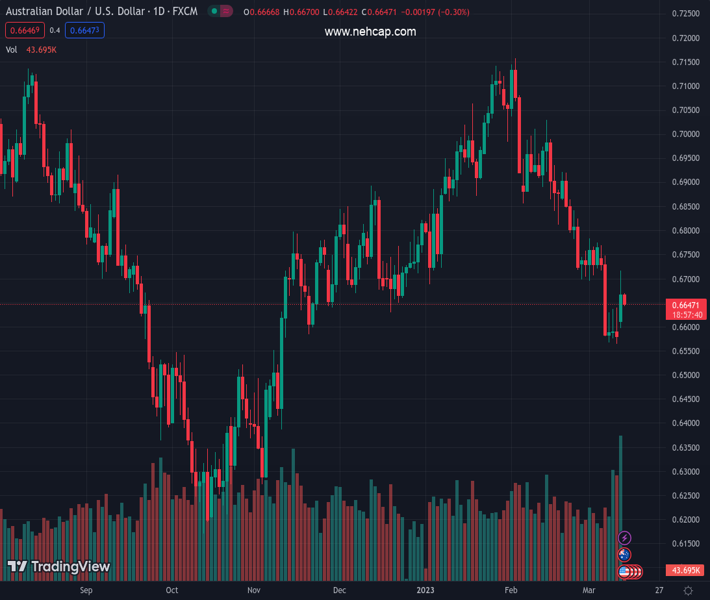
#AUDUSD @ 0.66451 consolidates the biggest daily gains in nine weeks amid sluggish markets. (Pivot Orderbook analysis)
…
This is a premium post.
[s2If !current_user_can(access_s2member_level4)]Please register for PREMIUM VERSION HERE to read full post below containing analysis. In case of any error or you think you are not able to read the full post below, please email us at support#nehcap.com [lwa][/s2If] [s2If current_user_can(access_s2member_level4)]
- AUD/USD consolidates the biggest daily gains in nine weeks amid sluggish markets.
- Traders take a breather following the SVB-infused volatility; US dollar licks its wounds ahead of US CPI.
- Downbeat Aussie NAB data, China fears also allowed Aussie bulls the much-needed break.
The pair currently trades last at 0.66451.
The previous day high was 0.6717 while the previous day low was 0.6579. The daily 38.2% Fib levels comes at 0.6664, expected to provide resistance. Similarly, the daily 61.8% fib level is at 0.6632, expected to provide support.
AUD/USD drops to 0.6650, down 0.25% on a day, as traders position themselves for the US inflation data during early Tuesday. The quote’s latest weakness could also be linked to the market’s fears surrounding China and Russia, as well as downbeat data from Australia. That said, the Aussie pair rose the most since early February on the previous day amid broad-based US Dollar weakness.
National Australia Bank’s (NAB) sentiment indices for February marked downbeat figures and allowed the AUD/USD bulls to take a breather. It should be noted that the NAB Business Conditions dropped to 17 from 18, versus 21 market forecasts, whereas the NAB Business Confidence nosedived to -4.0 compared to 0.0% analysts’ estimates and 6.0% prior.
Elsewhere, US Treasury bond yields print mild gains after falling heavily the previous day. On the same line is the latest minor upside by the S&P 500 Futures. With this, the US 10-year Treasury bond yields seesaw around 3.56%, after bouncing off the monthly bottom of 3.418%, whereas the two-year counterpart bounces off the lowest levels since September 2022 to print mild gains of around 4.05% by the press time.
Apart from the market positioning and NAB data, the AUD/USD traders may also have traced the US inflation expectations to rally the previous day, before marking the latest loss. That said, the US inflation expectations per the 10-year and 5-year breakeven inflation rates from the St. Louis Federal Reserve (FRED) dropped to the lowest levels since early February. In doing so, the inflation precursors dropped for the consecutive fifth and sixth days for the five-year and 10-year gauges respectively.
Above all, the recent rebound in the US Treasury bond yields allowed the AUD/USD pair to consolidate the gains marked due to the US banking regulators’ defense of the Silicon Valley Bank (SVB) and the Signature Bank.
Even so, the blow to the Federal Reserve (Fed) bets seems to challenge the AUD/USD bears ahead of the key US Consumer Price Index (CPI) data for February. As per the latest updates from Reuters, the US Fed Fund Futures have priced in a 69% chance of a 25-bps hike at next week’s Fed policy meeting, with a more than 30% probability of a pause. The market last week was poised for a 50-bps increase prior to the SVB collapse, reported Reuters. On the same line could be the CME as it mentioned, “Traders see 33% chance Fed holds rates this month, market pricing shows rate cuts expected as early as June.”
Looking ahead, the US CPI will be important for intraday directions but major attention should be given to the risk catalysts and the yields. That said, the US CPI is likely to ease to 6.0% YoY versus 6.4% prior while CPI ex Food & Energy may slide to 5.5% YoY from 5.6% prior.
Failure to cross a five-week-old descending resistance line, around 0.6700 by the press time, directs AUD/USD bears towards the monthly low of near 0.6565.
Technical Levels: Supports and Resistances
AUDUSD currently trading at 0.665 at the time of writing. Pair opened at 0.6667 and is trading with a change of -0.25% % .
| Overview | Overview.1 | |
|---|---|---|
| 0 | Today last price | 0.665 |
| 1 | Today Daily Change | -0.0017 |
| 2 | Today Daily Change % | -0.25% |
| 3 | Today daily open | 0.6667 |
The pair remains strongly bearish on the daily time frame. It trades below the 20 SMA @ 0.6762, 50 SMA 0.6882, 100 SMA @ 0.6768 and 200 SMA @ 0.6775.
| Trends | Trends.1 | |
|---|---|---|
| 0 | Daily SMA20 | 0.6762 |
| 1 | Daily SMA50 | 0.6882 |
| 2 | Daily SMA100 | 0.6768 |
| 3 | Daily SMA200 | 0.6775 |
The previous day high was 0.6717 while the previous day low was 0.6579. The daily 38.2% Fib levels comes at 0.6664, expected to provide resistance. Similarly, the daily 61.8% fib level is at 0.6632, expected to provide support.
Note the levels of interest below:
- Pivot support is noted at 0.6592, 0.6516, 0.6454
- Pivot resistance is noted at 0.673, 0.6792, 0.6868
| Levels | Levels.1 |
|---|---|
| Previous Daily High | 0.6717 |
| Previous Daily Low | 0.6579 |
| Previous Weekly High | 0.6770 |
| Previous Weekly Low | 0.6564 |
| Previous Monthly High | 0.7158 |
| Previous Monthly Low | 0.6698 |
| Daily Fibonacci 38.2% | 0.6664 |
| Daily Fibonacci 61.8% | 0.6632 |
| Daily Pivot Point S1 | 0.6592 |
| Daily Pivot Point S2 | 0.6516 |
| Daily Pivot Point S3 | 0.6454 |
| Daily Pivot Point R1 | 0.6730 |
| Daily Pivot Point R2 | 0.6792 |
| Daily Pivot Point R3 | 0.6868 |
[/s2If]
Join Our Telegram Group
")


