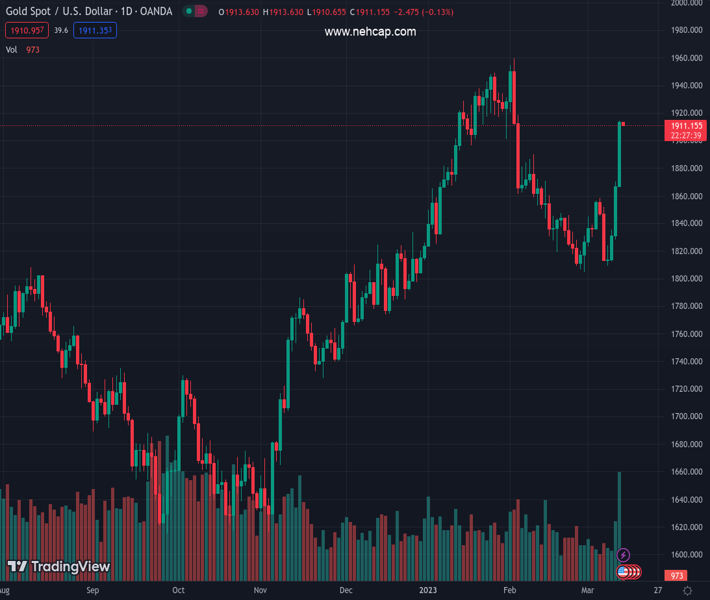
#XAUUSD @ 1,910.96 Gold price has delivered a three-day winning streak on hopes of a slowdown in the Fed’s policy tightening pace. (Pivot Orderbook analysis)
…
This is a premium post.
[s2If !current_user_can(access_s2member_level4)]Please register for PREMIUM VERSION HERE to read full post below containing analysis. In case of any error or you think you are not able to read the full post below, please email us at support#nehcap.com [lwa][/s2If] [s2If current_user_can(access_s2member_level4)]
- Gold price has delivered a three-day winning streak on hopes of a slowdown in the Fed’s policy tightening pace.
- Going forward, a sheer volatility is expected ahead of the US inflation data.
- A decisive break above 61.8% Fibo indicates that the asset will recapture the previous swing high ahead.
The pair currently trades last at 1910.96.
The previous day high was 1870.09 while the previous day low was 1827.77. The daily 38.2% Fib levels comes at 1853.92, expected to provide support. Similarly, the daily 61.8% fib level is at 1843.94, expected to provide support.
Gold price (XAU/USD) has refreshed its five-week high at $1,914.70 in the early Asian session. The precious metal has delivered a three-day winning streak and is expected to continue its upside momentum as a sudden collapse of Silicon Valley Bank (SVB) might force the Federal Reserve (Fed) to continue a lower pace of policy tightening if not halt the restrictive regime.
President Joe Biden said the administration’s swift actions to ensure depositors can access their funds in Silicon Valley Bank (SVB) and Signature Bank (SBNY) should give Americans confidence that the U.S. banking system was safe, as reported by Reuters.
The US Dollar Index (DXY) has sensed an intermediate cushion around 103.50, however, sheer volatility is expected ahead as investors will keep an eye on the United States Consumer Price Index (CPI) data.
Analysts at Credit Suisse expect “Expect core CPI inflation to remain steady at 0.4% MoM in February, causing the YoY reading to tick down to 5.5%. Energy and food prices are likely to moderate, with headline inflation also coming in at 0.4% MoM. A reading in-line with our expectations would be uncomfortably high for the Fed, but still consistent with gradual disinflation this year.”
S&P500 futures are showing marginal gains after a subdued Monday, a case of a dead cat bounce, however, the risk sentiment is still negative. The 10-year US Treasury yields dropped to 3.54% as Fed chair Jerome Powell won’t go heavy on interest rates to maintain consumer confidence in the economy.
Gold price has scaled above the 61.8% Fibonacci retracement (placed from February 2 high at $1,959.71 to February 28 low at $1,804.76) at $1.901.24. A decisive break above 61.8% Fibo indicates that the asset will recapture the previous swing high ahead.
Upward-sloping 20-and 50-period Exponential Moving Averages (EMAs) at $1,900 and $1,883.00 add to the upside filters.
The Relative Strength Index (RSI) (14) oscillates in the bullish range of 60.00-80.00, which indicates an upside momentum is already active. However, some corrections due to an overbought situation cannot be ruled out.
Technical Levels: Supports and Resistances
XAUUSD currently trading at 1911.37 at the time of writing. Pair opened at 1869.92 and is trading with a change of 2.22 % .
| Overview | Overview.1 | |
|---|---|---|
| 0 | Today last price | 1911.37 |
| 1 | Today Daily Change | 41.45 |
| 2 | Today Daily Change % | 2.22 |
| 3 | Today daily open | 1869.92 |
The pair remains strongly bullish on the daily timeframe. It trades above its 20 SMA @ 1835.48, 50 SMA 1871.07, 100 SMA @ 1810.46 and 200 SMA @ 1775.06.
| Trends | Trends.1 | |
|---|---|---|
| 0 | Daily SMA20 | 1835.48 |
| 1 | Daily SMA50 | 1871.07 |
| 2 | Daily SMA100 | 1810.46 |
| 3 | Daily SMA200 | 1775.06 |
The previous day high was 1870.09 while the previous day low was 1827.77. The daily 38.2% Fib levels comes at 1853.92, expected to provide support. Similarly, the daily 61.8% fib level is at 1843.94, expected to provide support.
Note the levels of interest below:
- Pivot support is noted at 1841.76, 1813.61, 1799.44
- Pivot resistance is noted at 1884.08, 1898.25, 1926.4
| Levels | Levels.1 |
|---|---|
| Previous Daily High | 1870.09 |
| Previous Daily Low | 1827.77 |
| Previous Weekly High | 1870.09 |
| Previous Weekly Low | 1809.46 |
| Previous Monthly High | 1959.80 |
| Previous Monthly Low | 1804.76 |
| Daily Fibonacci 38.2% | 1853.92 |
| Daily Fibonacci 61.8% | 1843.94 |
| Daily Pivot Point S1 | 1841.76 |
| Daily Pivot Point S2 | 1813.61 |
| Daily Pivot Point S3 | 1799.44 |
| Daily Pivot Point R1 | 1884.08 |
| Daily Pivot Point R2 | 1898.25 |
| Daily Pivot Point R3 | 1926.40 |
[/s2If]
Join Our Telegram Group
")


