#USDJPY @ 132.774 plunges to 133.50 as bearish sentiment for USD prevails (Pivot Orderbook analysis)
…
This is a premium post.
[s2If !current_user_can(access_s2member_level4)]Please register for PREMIUM VERSION HERE to read full post below containing analysis. In case of any error or you think you are not able to read the full post below, please email us at support#nehcap.com [lwa][/s2If] [s2If current_user_can(access_s2member_level4)]
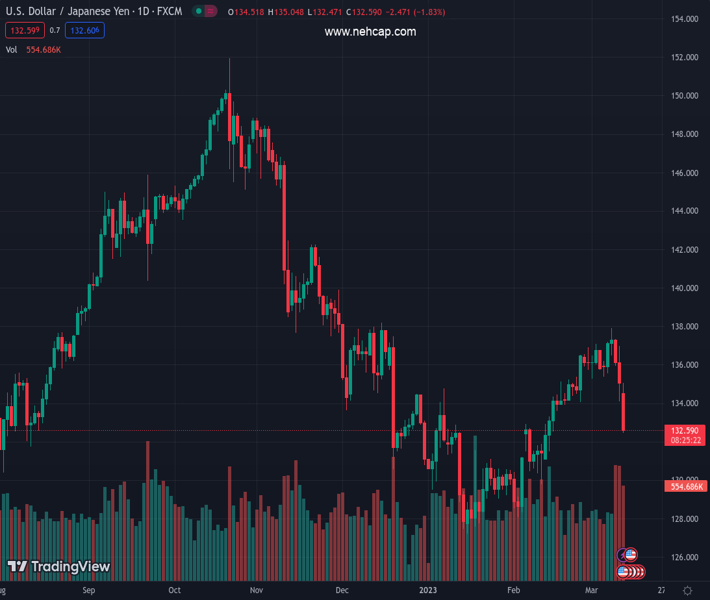
The pair currently trades last at 132.774.
The previous day high was 137.0 while the previous day low was 134.12. The daily 38.2% Fib levels comes at 135.22, expected to provide resistance. Similarly, the daily 61.8% fib level is at 135.89, expected to provide resistance.
USD/JPY opens the day of a new week at 134.97, dropping to an intraday low of 132.96 before hitting an intraday high of 134.99. The pair continues to struggle to gain amid bearish market sentiment, trading at 133.50 above its 50-day SMA of 132.41, down by 1.10% on the day at the press time.
There is no critical economic event on the day that may affect the price of USD/JPY on Monday, the week’s first and relatively silent day.
Markets will be closely monitoring the Consumer Price Index ex Food & Energy (MoM)(Feb) released by the US Department of Labor Statistics (Tue, Mar 14th, 2023 12:30 GMT) and Bank of Japan’s (BoJ) Monetary Meeting Minutes (Tue, Mar 14th, 2023 23:50 GMT).
Technical indicators for USD/JPY pair show a bearish bias in the short-term outlook. The daily chart indicates that the Daily 38.2% Fibonacci level at 135.22 remains critical support, while the Daily 61.8% Fibonacci level at 135.89 acts as critical resistance. The RSI(14), currently at 42.121, confirms the bearish sentiment for the currency pair. The daily pivot support levels for USD/JPY are 133.65, 132.44, and 130.77, while the resistance levels are 136.53, 138.20, and 139.41.
Technical Levels: Supports and Resistances
USDJPY currently trading at 133.15 at the time of writing. Pair opened at 134.86 and is trading with a change of -1.27 % .
| Overview | Overview.1 | |
|---|---|---|
| 0 | Today last price | 133.15 |
| 1 | Today Daily Change | -1.71 |
| 2 | Today Daily Change % | -1.27 |
| 3 | Today daily open | 134.86 |
The pair is trading below its 20 Daily moving average @ 135.26, above its 50 Daily moving average @ 132.41 , below its 100 Daily moving average @ 135.98 and below its 200 Daily moving average @ 137.48
| Trends | Trends.1 | |
|---|---|---|
| 0 | Daily SMA20 | 135.26 |
| 1 | Daily SMA50 | 132.41 |
| 2 | Daily SMA100 | 135.98 |
| 3 | Daily SMA200 | 137.48 |
The previous day high was 137.0 while the previous day low was 134.12. The daily 38.2% Fib levels comes at 135.22, expected to provide resistance. Similarly, the daily 61.8% fib level is at 135.89, expected to provide resistance.
Note the levels of interest below:
- Pivot support is noted at 133.65, 132.44, 130.77
- Pivot resistance is noted at 136.53, 138.2, 139.41
| Levels | Levels.1 |
|---|---|
| Previous Daily High | 137.00 |
| Previous Daily Low | 134.12 |
| Previous Weekly High | 137.91 |
| Previous Weekly Low | 134.12 |
| Previous Monthly High | 136.92 |
| Previous Monthly Low | 128.08 |
| Daily Fibonacci 38.2% | 135.22 |
| Daily Fibonacci 61.8% | 135.89 |
| Daily Pivot Point S1 | 133.65 |
| Daily Pivot Point S2 | 132.44 |
| Daily Pivot Point S3 | 130.77 |
| Daily Pivot Point R1 | 136.53 |
| Daily Pivot Point R2 | 138.20 |
| Daily Pivot Point R3 | 139.41 |
[/s2If]
Join Our Telegram Group
")


