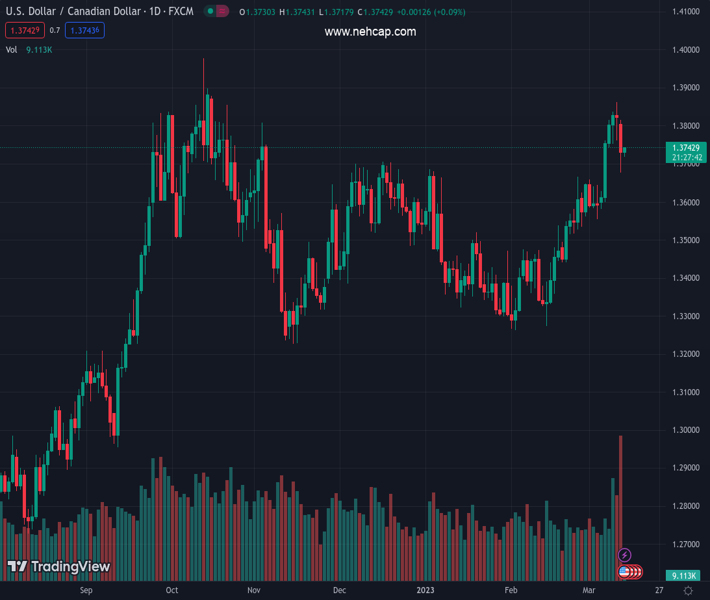
#USDCAD @ 1.37410 keeps recent bounce off one-week low after falling the most in a month. (Pivot Orderbook analysis)
…
This is a premium post.
[s2If !current_user_can(access_s2member_level4)]Please register for PREMIUM VERSION HERE to read full post below containing analysis. In case of any error or you think you are not able to read the full post below, please email us at support#nehcap.com [lwa][/s2If] [s2If current_user_can(access_s2member_level4)]
- USD/CAD keeps recent bounce off one-week low after falling the most in a month.
- WTI refreshed three-month low before making rounds to $75.00.
- Market sentiment dwindles amid SVB, Signature Bank fallout but US Dollar bears the burden of the downbeat Treasury yields.
- Risk catalysts eyed closely ahead of US CPI for February.
The pair currently trades last at 1.37410.
The previous day high was 1.3862 while the previous day low was 1.3761. The daily 38.2% Fib levels comes at 1.38, expected to provide resistance. Similarly, the daily 61.8% fib level is at 1.3823, expected to provide resistance.
USD/CAD licks its wounds around 1.3740, after marking the biggest daily slump in a month the previous day. In doing so, the Loonie pair portrays the market’s positioning for the US Consumer Price Index (CPI) data while struggling to cheer the latest rebound in the Oil price, Canada’s main export item.
The quote ignored the WTI crude oil’s slump towards refreshing a three-month low to $72.42, before a rebound to $74.90 at the latest, amid the broad US Dollar weakness due to the reduction in the hawkish Federal Reserve (Fed) bets.
That said, the US Dollar Index (DXY) began the week’s trading on a back foot by printing a three-day south-run while declining the most in two months on Monday, licking its wounds near 103.68 at the latest. With this, the greenback’s gauge versus the six major currencies traced the US Treasury bond yields as hawkish bets on the Federal Reserve (Fed) reverberate.
US two-year Treasury bond yields marked the biggest daily slump since October 1987 by declining more than 13.0% on a day as US banking regulators rushed to defend the Silicon Valley Bank (SVB) and the Signature Bank. Further, the US 10-year Treasury bond yields slumped to the monthly low amid a sudden shift in the market’s Fed bets due to the financial market risks emanating from the stated banks.
While portraying the latest shift in the US Fed Fund Futures, Reuters said that the US rate futures on Monday have priced in a 69% chance of a 25-bps hike at next week’s Fed policy meeting, with a more than 30% probability of a pause. The market last week was poised for a 50-bps increase prior to the SVB collapse.
Looking ahead, the US inflation data for February will be important to watch for clear directions. Forecasts suggest the US CPI is likely to ease to 6.0% YoY versus 6.4% prior while CPI ex Food & Energy may slide to 5.5% YoY from 5.6% prior. It’s worth noting that Canada Manufacturing Sales for January, around 3.9% versus -1.5% prior, will also be important to better predict the USD/CAD pair’s immediate moves. However, major attention should be given to the yields and the market’s risk catalysts for better directions.
Also read: US Inflation Preview: Five scenarios for trading the Core CPI whipsaw within the SVB storm
A daily closing below a one-month-old ascending support line, around 1.3705 by the press time, becomes necessary for the USD/CAD bears to take control.
Technical Levels: Supports and Resistances
USDCAD currently trading at 1.3737 at the time of writing. Pair opened at 1.3833 and is trading with a change of -0.69% % .
| Overview | Overview.1 | |
|---|---|---|
| 0 | Today last price | 1.3737 |
| 1 | Today Daily Change | -0.0096 |
| 2 | Today Daily Change % | -0.69% |
| 3 | Today daily open | 1.3833 |
The pair remains strongly bullish on the daily timeframe. It trades above its 20 SMA @ 1.3576, 50 SMA 1.348, 100 SMA @ 1.3504 and 200 SMA @ 1.3313.
| Trends | Trends.1 | |
|---|---|---|
| 0 | Daily SMA20 | 1.3576 |
| 1 | Daily SMA50 | 1.3480 |
| 2 | Daily SMA100 | 1.3504 |
| 3 | Daily SMA200 | 1.3313 |
The previous day high was 1.3862 while the previous day low was 1.3761. The daily 38.2% Fib levels comes at 1.38, expected to provide resistance. Similarly, the daily 61.8% fib level is at 1.3823, expected to provide resistance.
Note the levels of interest below:
- Pivot support is noted at 1.3775, 1.3718, 1.3675
- Pivot resistance is noted at 1.3876, 1.3919, 1.3977
| Levels | Levels.1 |
|---|---|
| Previous Daily High | 1.3862 |
| Previous Daily Low | 1.3761 |
| Previous Weekly High | 1.3862 |
| Previous Weekly Low | 1.3582 |
| Previous Monthly High | 1.3666 |
| Previous Monthly Low | 1.3262 |
| Daily Fibonacci 38.2% | 1.3800 |
| Daily Fibonacci 61.8% | 1.3823 |
| Daily Pivot Point S1 | 1.3775 |
| Daily Pivot Point S2 | 1.3718 |
| Daily Pivot Point S3 | 1.3675 |
| Daily Pivot Point R1 | 1.3876 |
| Daily Pivot Point R2 | 1.3919 |
| Daily Pivot Point R3 | 1.3977 |
[/s2If]
Join Our Telegram Group
")


