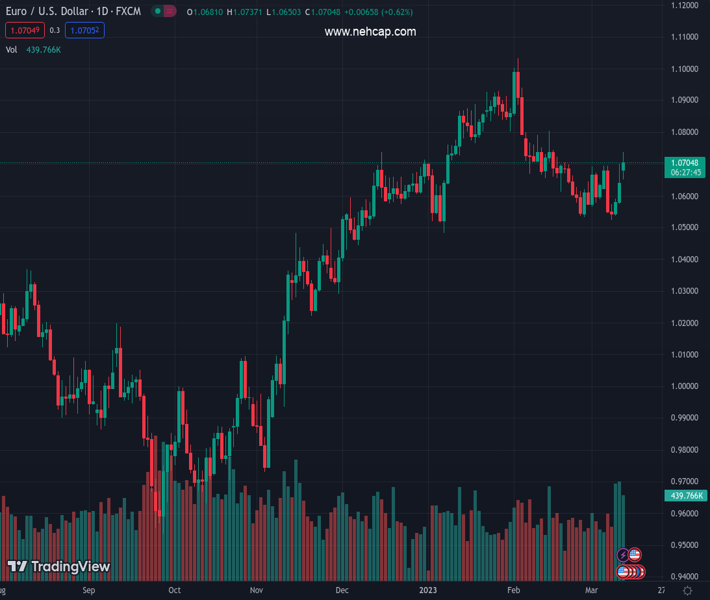
#EURUSD @ 1.06430 The upside momentum in picks up pace on Monday. (Pivot Orderbook analysis)
…
This is a premium post.
[s2If !current_user_can(access_s2member_level4)]Please register for PREMIUM VERSION HERE to read full post below containing analysis. In case of any error or you think you are not able to read the full post below, please email us at support#nehcap.com [lwa][/s2If] [s2If current_user_can(access_s2member_level4)]
- The upside momentum in EUR/USD picks up pace on Monday.
- Next on the upside comes the 1.0800 mark.
The pair currently trades last at 1.06430.
The previous day high was 1.0701 while the previous day low was 1.0574. The daily 38.2% Fib levels comes at 1.0652, expected to provide resistance. Similarly, the daily 61.8% fib level is at 1.0622, expected to provide support.
EUR/USD extends the buying interest to fresh multi-week highs north of 1.0700 the figure at the beginning of the week.
The continuation of the uptrend appears favoured for the time being. Against that, a convincing move above Monday’s peak at 1.0737 should open the door the wekly high at 1.0804 (February 14). Further up, there are no resistance levels of note until the 2023 high at 1.1032 (February 2).
Looking at the longer run, the constructive view remains unchanged while above the 200-day SMA, today at 1.0324.
Technical Levels: Supports and Resistances
EURUSD currently trading at 1.0721 at the time of writing. Pair opened at 1.0637 and is trading with a change of 0.79 % .
| Overview | Overview.1 | |
|---|---|---|
| 0 | Today last price | 1.0721 |
| 1 | Today Daily Change | 87.0000 |
| 2 | Today Daily Change % | 0.7900 |
| 3 | Today daily open | 1.0637 |
The pair is trading above its 20 Daily moving average @ 1.0634, below its 50 Daily moving average @ 1.0722 , above its 100 Daily moving average @ 1.0534 and above its 200 Daily moving average @ 1.0326
| Trends | Trends.1 | |
|---|---|---|
| 0 | Daily SMA20 | 1.0634 |
| 1 | Daily SMA50 | 1.0722 |
| 2 | Daily SMA100 | 1.0534 |
| 3 | Daily SMA200 | 1.0326 |
The previous day high was 1.0701 while the previous day low was 1.0574. The daily 38.2% Fib levels comes at 1.0652, expected to provide resistance. Similarly, the daily 61.8% fib level is at 1.0622, expected to provide support.
Note the levels of interest below:
- Pivot support is noted at 1.0574, 1.0511, 1.0447
- Pivot resistance is noted at 1.07, 1.0764, 1.0827
| Levels | Levels.1 |
|---|---|
| Previous Daily High | 1.0701 |
| Previous Daily Low | 1.0574 |
| Previous Weekly High | 1.0701 |
| Previous Weekly Low | 1.0524 |
| Previous Monthly High | 1.1033 |
| Previous Monthly Low | 1.0533 |
| Daily Fibonacci 38.2% | 1.0652 |
| Daily Fibonacci 61.8% | 1.0622 |
| Daily Pivot Point S1 | 1.0574 |
| Daily Pivot Point S2 | 1.0511 |
| Daily Pivot Point S3 | 1.0447 |
| Daily Pivot Point R1 | 1.0700 |
| Daily Pivot Point R2 | 1.0764 |
| Daily Pivot Point R3 | 1.0827 |
[/s2If]
Join Our Telegram Group
")


