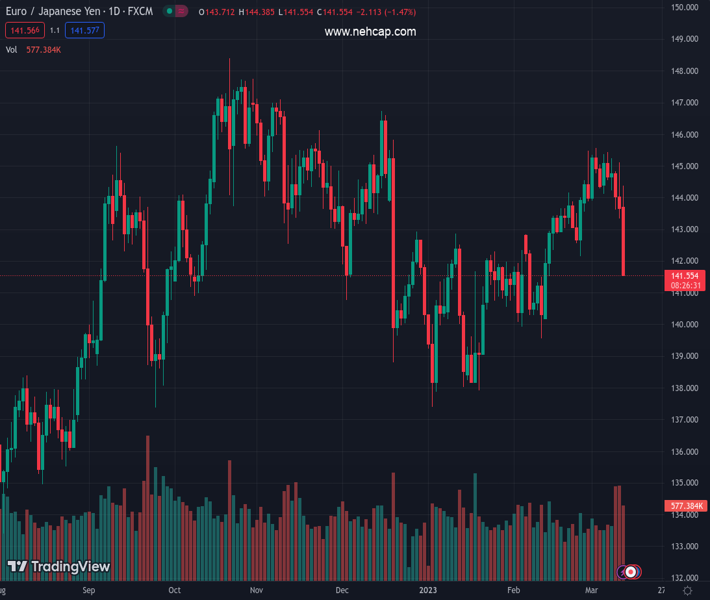
#EURJPY @ 141.645 falls off the cliff and retests the 200-day SMA near 141.80. (Pivot Orderbook analysis)
…
This is a premium post.
[s2If !current_user_can(access_s2member_level4)]Please register for PREMIUM VERSION HERE to read full post below containing analysis. In case of any error or you think you are not able to read the full post below, please email us at support#nehcap.com [lwa][/s2If] [s2If current_user_can(access_s2member_level4)]
- EUR/JPY falls off the cliff and retests the 200-day SMA near 141.80.
- The next support level emerges at the February low in the mid-139.00s.
The pair currently trades last at 141.645.
The previous day high was 145.11 while the previous day low was 143.35. The daily 38.2% Fib levels comes at 144.02, expected to provide resistance. Similarly, the daily 61.8% fib level is at 144.44, expected to provide resistance.
EUR/JPY debilitates further and breaks below the 142.00 to print new 4-week lows near 141.80 at the beginning of the week.
EUR/JPY breaks below the consolidative range and challenges the key 200-day SMA, today at 141.77. A sustainable breach of the latter should open the door to extra weakness to, initially, the February low at 139.54 (February 10).
Below the 200-day SMA the outlook for the cross is expected to shift to negative.
Technical Levels: Supports and Resistances
EURJPY currently trading at 141.92 at the time of writing. Pair opened at 143.45 and is trading with a change of -1.07 % .
| Overview | Overview.1 | |
|---|---|---|
| 0 | Today last price | 141.92 |
| 1 | Today Daily Change | 250.00 |
| 2 | Today Daily Change % | -1.07 |
| 3 | Today daily open | 143.45 |
The pair is trading below its 20 Daily moving average @ 143.83, below its 50 Daily moving average @ 141.94 , below its 100 Daily moving average @ 143.1 and above its 200 Daily moving average @ 141.8
| Trends | Trends.1 | |
|---|---|---|
| 0 | Daily SMA20 | 143.83 |
| 1 | Daily SMA50 | 141.94 |
| 2 | Daily SMA100 | 143.10 |
| 3 | Daily SMA200 | 141.80 |
The previous day high was 145.11 while the previous day low was 143.35. The daily 38.2% Fib levels comes at 144.02, expected to provide resistance. Similarly, the daily 61.8% fib level is at 144.44, expected to provide resistance.
Note the levels of interest below:
- Pivot support is noted at 142.83, 142.21, 141.07
- Pivot resistance is noted at 144.59, 145.73, 146.35
| Levels | Levels.1 |
|---|---|
| Previous Daily High | 145.11 |
| Previous Daily Low | 143.35 |
| Previous Weekly High | 145.44 |
| Previous Weekly Low | 143.35 |
| Previous Monthly High | 145.47 |
| Previous Monthly Low | 139.55 |
| Daily Fibonacci 38.2% | 144.02 |
| Daily Fibonacci 61.8% | 144.44 |
| Daily Pivot Point S1 | 142.83 |
| Daily Pivot Point S2 | 142.21 |
| Daily Pivot Point S3 | 141.07 |
| Daily Pivot Point R1 | 144.59 |
| Daily Pivot Point R2 | 145.73 |
| Daily Pivot Point R3 | 146.35 |
[/s2If]
Join Our Telegram Group
")


