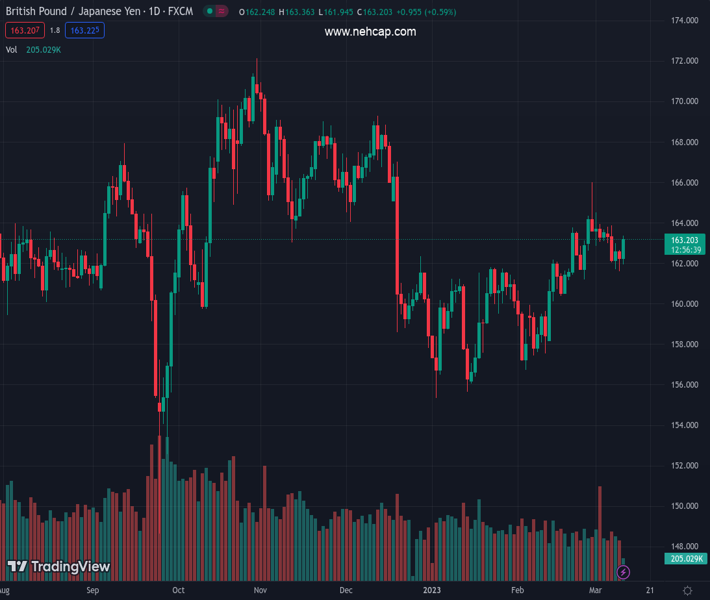
#GBPJPY @ 163.185 struggles to capitalize in the intraday move up and fails near the 200-day SMA. (Pivot Orderbook analysis)
…
This is a premium post.
[s2If !current_user_can(access_s2member_level4)]Please register for PREMIUM VERSION HERE to read full post below containing analysis. In case of any error or you think you are not able to read the full post below, please email us at support#nehcap.com [lwa][/s2If] [s2If current_user_can(access_s2member_level4)]
- GBP/JPY struggles to capitalize in the intraday move up and fails near the 200-day SMA.
- The BoJ’s decision to leave policy settings unchanged weighs on the JPY and lends support.
- The mixed UK macro data and the risk-off environment keeps a lid on any further gains.
The pair currently trades last at 163.185.
The previous day high was 162.79 while the previous day low was 161.62. The daily 38.2% Fib levels comes at 162.06, expected to provide support. Similarly, the daily 61.8% fib level is at 162.34, expected to provide support.
The GBP/JPY cross attracts fresh sellers near a technically significant 200-day Simple Moving Average (SMA) on Friday and its goodish intraday rally from sub-162.00 levels. Spot prices surrender a major part of the Bank of Japan (BoJ)-inspired gains and retreat to mid-162.00s during the early part of the European session.
The Japanese Yen (JPY) weakens across the board in a knee-jerk reaction to the BoJ’s decision to keep monetary policy settings unchanged at the end of a two-day meeting on Friday. This, in turn, assists the GBP/JPY cross to regain positive traction and build on the previous day’s bounce from the 161.60 area, or a nearly two-week low. The uptick gets an additional boost following the release of better-than-expected UK GDP print, which showed that the economy expanded by 0.3% in January as compared to the 0.5% contraction recorded in the previous month.
That said, the UK Manufacturing and Industrial Production contracted more-than-anticipated last month, which, in turn, holds back traders from placing aggressive bullish bets around the British Pound. Apart from this, the prevalent risk-off environment – as depicted by a sea of red across the global equity markets – drives some haven flows towards the JPY and further contributes to capping the upside for the GBP/JPY cross. This, in turn, warrants some caution before positioning for the resumption of the recent upward trajectory witnessed since early February.
The downside, meanwhile, seems limited amid expectations that the BoJ will stick to its dovish stance to support the fragile domestic economy. The bets were lifted by this week’s release of the final GDP print from Japan, which showed that the economy narrowly averted a recession in the final quarter of 2022 and reaffirmed continued weakness in the economy. Moreover, the incoming BoJ Governor Kazuo Ueda recently stressed the need to maintain the ultra-loose policy settings and said that the central bank isn’t seeking a quick move away from a decade of massive easing.
The aforementioned mixed fundamental backdrop makes it prudent to wait for a sustained move in either direction before positioning for the near-term trajectory for the GBP/JPY cross.
Technical Levels: Supports and Resistances
GBPJPY currently trading at 162.84 at the time of writing. Pair opened at 162.23 and is trading with a change of 0.38 % .
| Overview | Overview.1 | |
|---|---|---|
| 0 | Today last price | 162.84 |
| 1 | Today Daily Change | 0.61 |
| 2 | Today Daily Change % | 0.38 |
| 3 | Today daily open | 162.23 |
The pair is trading above its 20 Daily moving average @ 162.3, above its 50 Daily moving average @ 160.49 , below its 100 Daily moving average @ 163.34 and below its 200 Daily moving average @ 163.44
| Trends | Trends.1 | |
|---|---|---|
| 0 | Daily SMA20 | 162.30 |
| 1 | Daily SMA50 | 160.49 |
| 2 | Daily SMA100 | 163.34 |
| 3 | Daily SMA200 | 163.44 |
The previous day high was 162.79 while the previous day low was 161.62. The daily 38.2% Fib levels comes at 162.06, expected to provide support. Similarly, the daily 61.8% fib level is at 162.34, expected to provide support.
Note the levels of interest below:
- Pivot support is noted at 161.64, 161.04, 160.46
- Pivot resistance is noted at 162.81, 163.38, 163.98
| Levels | Levels.1 |
|---|---|
| Previous Daily High | 162.79 |
| Previous Daily Low | 161.62 |
| Previous Weekly High | 166.01 |
| Previous Weekly Low | 162.61 |
| Previous Monthly High | 166.01 |
| Previous Monthly Low | 156.73 |
| Daily Fibonacci 38.2% | 162.06 |
| Daily Fibonacci 61.8% | 162.34 |
| Daily Pivot Point S1 | 161.64 |
| Daily Pivot Point S2 | 161.04 |
| Daily Pivot Point S3 | 160.46 |
| Daily Pivot Point R1 | 162.81 |
| Daily Pivot Point R2 | 163.38 |
| Daily Pivot Point R3 | 163.98 |
[/s2If]
Join Our Telegram Group
")


