#USDJPY @ 136.286 meets with some supply on Thursday and is pressured by a combination of factors. (Pivot Orderbook analysis)
…
This is a premium post.
[s2If !current_user_can(access_s2member_level4)]Please register for PREMIUM VERSION HERE to read full post below containing analysis. In case of any error or you think you are not able to read the full post below, please email us at support#nehcap.com [lwa][/s2If] [s2If current_user_can(access_s2member_level4)]
- USD/JPY meets with some supply on Thursday and is pressured by a combination of factors.
- Recession fears benefit the safe-haven JPY and weigh on the pair amid a modest USD slide.
- The Fed-BoJ policy divergence favours bulls and should help limit any meaningful downfall.
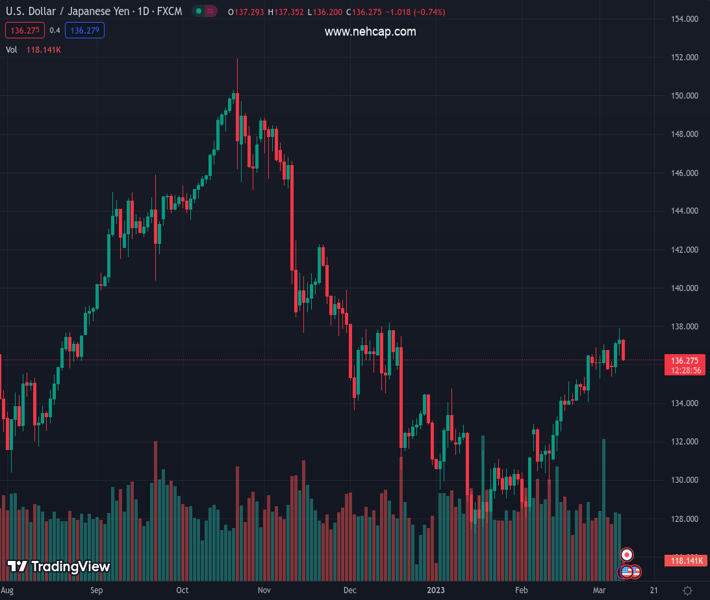
The pair currently trades last at 136.286.
The previous day high was 137.91 while the previous day low was 136.48. The daily 38.2% Fib levels comes at 137.37, expected to provide resistance. Similarly, the daily 61.8% fib level is at 137.03, expected to provide resistance.
The USD/JPY pair comes under some selling pressure on Thursday and moves away from its highest level since mid-December, around the 137.90 region touched the previous day. The pair extends its steady intraday descent through the first half of the European session and drops to a fresh daily low, around the 136.20 region in the last hour.
Worries about a deeper global economic downturn continue to weigh on investors’ sentiment, which, in turn, is seen benefiting the safe-haven Japanese Yen (JPY) and dragging the USD/JPY pair lower. The concerns were further fueled by softer Chinese inflation figures released earlier this Thursday, which showed that domestic demand remains tepid and dashed hopes for a strong recovery in the world’s second-largest economy. This, along with a modest US Dollar pullback from a three-month top, contributes to the offered toe surrounding the major.
The downside for the USD/JPY pair, however, is more likely to remain limited, at least for the time being, amid expectations that the Bank of Japan (BoJ) will stick to its dovish stance to support the fragile domestic economy. The bets were reaffirmed by the release of the final GDP print, which pointed to continued weakness in the economy. Moreover, the incoming BoJ Governor Kazuo Ueda recently stressed the need to maintain the ultra-loose policy settings and said that the central bank isn’t seeking a quick move away from a decade of massive easing.
In contrast, Federal Reserve Chair Jerome Powell reiterated on Wednesday that interest rates would have to go higher and possibly faster to tame stubbornly high inflation. In fact, the markets are now pricing in a greater chance of a jumbo 50 bps lift-off at the next FOMC meeting on March 21-21, which remains supportive of elevated US Treasury bond yields. This, in turn, favours the USD bulls and supports prospects for the emergence of some dip-buying around the USD/JPY pair, warranting caution before positioning for any meaningful corrective fall.
Market participants now look to the US economic docket, featuring the release of Challenger Job Cuts and the usual Weekly Initial Jobless Claims later during the early North America session. The focus, however, will remain on the BoJ monetary policy decision, scheduled to be announced during the Asian session on Friday. This will be followed by the US monthly jobs data, popularly known as the NFP report, which should help investors to determine the next leg of a directional move for the USD/JPY pair.
Technical Levels: Supports and Resistances
USDJPY currently trading at 136.45 at the time of writing. Pair opened at 137.25 and is trading with a change of -0.58 % .
| Overview | Overview.1 | |
|---|---|---|
| 0 | Today last price | 136.45 |
| 1 | Today Daily Change | -0.80 |
| 2 | Today Daily Change % | -0.58 |
| 3 | Today daily open | 137.25 |
The pair is trading above its 20 Daily moving average @ 134.86, above its 50 Daily moving average @ 132.27 , above its 100 Daily moving average @ 136.25 and below its 200 Daily moving average @ 137.43
| Trends | Trends.1 | |
|---|---|---|
| 0 | Daily SMA20 | 134.86 |
| 1 | Daily SMA50 | 132.27 |
| 2 | Daily SMA100 | 136.25 |
| 3 | Daily SMA200 | 137.43 |
The previous day high was 137.91 while the previous day low was 136.48. The daily 38.2% Fib levels comes at 137.37, expected to provide resistance. Similarly, the daily 61.8% fib level is at 137.03, expected to provide resistance.
Note the levels of interest below:
- Pivot support is noted at 136.51, 135.78, 135.08
- Pivot resistance is noted at 137.95, 138.64, 139.38
| Levels | Levels.1 |
|---|---|
| Previous Daily High | 137.91 |
| Previous Daily Low | 136.48 |
| Previous Weekly High | 137.10 |
| Previous Weekly Low | 135.26 |
| Previous Monthly High | 136.92 |
| Previous Monthly Low | 128.08 |
| Daily Fibonacci 38.2% | 137.37 |
| Daily Fibonacci 61.8% | 137.03 |
| Daily Pivot Point S1 | 136.51 |
| Daily Pivot Point S2 | 135.78 |
| Daily Pivot Point S3 | 135.08 |
| Daily Pivot Point R1 | 137.95 |
| Daily Pivot Point R2 | 138.64 |
| Daily Pivot Point R3 | 139.38 |
[/s2If]
Join Our Telegram Group
")


