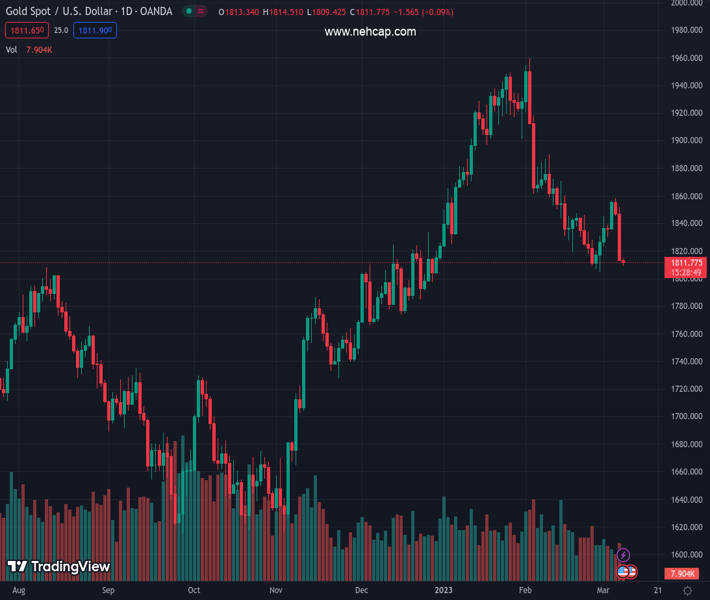
#XAUUSD @ 1,811.85 Gold price seesaws around one-week low amid broad US Dollar strength, quiet markets., @nehcap view: Further downside expected (Pivot Orderbook analysis)
…
This is a premium post.
[s2If !current_user_can(access_s2member_level4)]Please register for PREMIUM VERSION HERE to read full post below containing analysis. In case of any error or you think you are not able to read the full post below, please email us at support#nehcap.com [lwa][/s2If] [s2If current_user_can(access_s2member_level4)]
- Gold price seesaws around one-week low amid broad US Dollar strength, quiet markets.
- Fed Chair Powell’s influence on US Treasury bond yield curve acts as the key negative for XAU/USD price.
- Mixed China-linked headlines, light calendar restrict immediate Gold price decline ahead of US ADP Employment Change.
- Updates from Federal Reserve Chairman Jerome Powell’s Testimony 2.0 will also be important for Gold traders.
The pair currently trades last at 1811.85.
The previous day high was 1851.73 while the previous day low was 1812.81. The daily 38.2% Fib levels comes at 1827.68, expected to provide resistance. Similarly, the daily 61.8% fib level is at 1836.86, expected to provide resistance.
Gold price (XAU/USD) remains sidelined around $1,812, after refreshing the weekly low earlier in the day, as markets turn dicey ahead of the top-tier data/events scheduled for release on Wednesday. In addition to the pre-data anxiety, a light calendar in Asia and reassessment of the Federal Reserve’s (Fed) hawkish calls, as well as headlines surrounding China, also prod the XAU/USD bears after posting the biggest daily slump in a month.
The US removal of the testing restrictions on travelers from China appears an immediate challenge for the Gold bears amid silence after the storm. On the same line could be the talks surrounding a sooner end to the Bank of Japan’s (BoJ) ultra-easy money policy, which in turn allowed the US bond bears to take a breather as Tokyo is Washington’s biggest bond buyer.
That said, Fed Chair Powell surprised traders by showing readiness for more rate hikes and bolstered the bets of a 50 bps Fed rate hike in March during the Semi-Annual Testimony before the US Congress on Tuesday. The policymaker propelled the “higher for longer” Fed rate expectations and bolstered the US Treasury bond yields while weighing on the equities. His comments propelled the yields and the US Dollar.
Adding strength to the US Dollar’s upside were the market’s fears of more US-China tussles as officials from the US and Taiwan are up for a meeting, which in turn could tease Beijing.
It should be noted that Fed Chair Powell’s hawkish remarks widened the difference between the US 10-year and two-year Treasury bond yields, which in turn propelled the recession woes and exert downside pressure on the XAU/USD price. The US 10-year Treasury bond yields rose 0.15% while closing around 3.97% on Tuesday but the two-year counterpart gained 2.60% on a day when poking the highest levels since 2007, to 5.02% at the latest.
Against this backdrop, the S&P 500 Futures remain indecisive around the 3,988 level after falling the most in two weeks the previous day. On the other hand, the difference between the 10-year and two-year US bond coupons marked the deepest yield curve inversion in more than 40 years the previous day, keeping it intact by the press time
Looking ahead, the US ADP Employment Change for February and the second round of Fed Chair Jerome Powell’s Testimony will be important for fresh directions ahead of Friday’s US Nonfarm Payrolls (NFP).
Late during the last week, the Gold price marked another reversal from the 200-bar Exponential Moving Average (EMA). The pullback stretched towards breaking 13-day-old horizontal support, now resistance around $1,817, following Federal Reserve Chairman Jerome Powell’s first round of Semi-Annual Testimony on Monetary Policy.
Given the bearish signals from the Moving Average Convergence and Divergence (MACD) indicator, the XAU/USD is likely to witness further downside.
However, the Relative Strength Index (RSI) line, placed at 14, approaches the oversold territory, which in turn suggests a pause in the Gold price’s decline.
With this, the previous monthly low of around $1,804 and the $1,800 threshold could gain the market’s attention.
In a case where the XAU/USD drops below the $1,800 round figure, the 61.8% Fibonacci Expansion (FE) of the metal’s moves between February 02 to March 06, around $1,787, could lure the Gold bears.
Meanwhile, the aforementioned horizontal support-turned-resistance guards the XAU/USD’s immediate upside near $1,817, a break of which will again shift the market’s focus to the 200- EMA level surrounding $1,851.
It’s worth noting that the February 09 high and the 50% Fibonacci retracement level of the Gold price weakness during the last month, respectively near $1,890 and the $1,900 round figure, act as the last defense of the XAU/USD bears.
Overall, Gold remains on the bear’s radar but the downside room appears limited.
Trend: Further downside expected
Technical Levels: Supports and Resistances
XAUUSD currently trading at 1813.02 at the time of writing. Pair opened at 1814.1 and is trading with a change of -0.06% % .
| Overview | Overview.1 | |
|---|---|---|
| 0 | Today last price | 1813.02 |
| 1 | Today Daily Change | -1.08 |
| 2 | Today Daily Change % | -0.06% |
| 3 | Today daily open | 1814.1 |
The pair is trading below its 20 Daily moving average @ 1839.8, below its 50 Daily moving average @ 1869.64 , above its 100 Daily moving average @ 1804.46 and above its 200 Daily moving average @ 1775.32
| Trends | Trends.1 | |
|---|---|---|
| 0 | Daily SMA20 | 1839.80 |
| 1 | Daily SMA50 | 1869.64 |
| 2 | Daily SMA100 | 1804.46 |
| 3 | Daily SMA200 | 1775.32 |
The previous day high was 1851.73 while the previous day low was 1812.81. The daily 38.2% Fib levels comes at 1827.68, expected to provide resistance. Similarly, the daily 61.8% fib level is at 1836.86, expected to provide resistance.
Note the levels of interest below:
- Pivot support is noted at 1800.7, 1787.29, 1761.78
- Pivot resistance is noted at 1839.62, 1865.13, 1878.54
| Levels | Levels.1 |
|---|---|
| Previous Daily High | 1851.73 |
| Previous Daily Low | 1812.81 |
| Previous Weekly High | 1856.35 |
| Previous Weekly Low | 1804.76 |
| Previous Monthly High | 1959.80 |
| Previous Monthly Low | 1804.76 |
| Daily Fibonacci 38.2% | 1827.68 |
| Daily Fibonacci 61.8% | 1836.86 |
| Daily Pivot Point S1 | 1800.70 |
| Daily Pivot Point S2 | 1787.29 |
| Daily Pivot Point S3 | 1761.78 |
| Daily Pivot Point R1 | 1839.62 |
| Daily Pivot Point R2 | 1865.13 |
| Daily Pivot Point R3 | 1878.54 |
[/s2If]
Join Our Telegram Group
")


