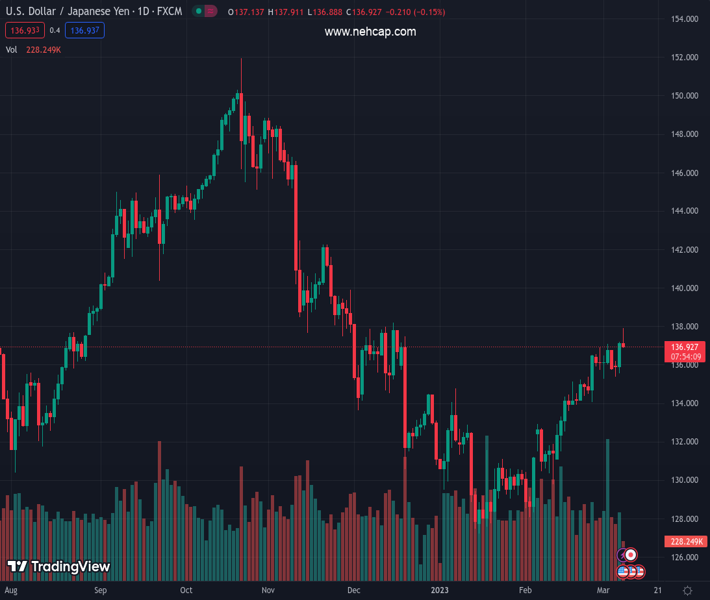
#USDJPY @ 136.968 pulls back from a fresh YTD peak touched earlier this Wednesday. (Pivot Orderbook analysis)
…
This is a premium post.
[s2If !current_user_can(access_s2member_level4)]Please register for PREMIUM VERSION HERE to read full post below containing analysis. In case of any error or you think you are not able to read the full post below, please email us at support#nehcap.com [lwa][/s2If] [s2If current_user_can(access_s2member_level4)]
- USD/JPY pulls back from a fresh YTD peak touched earlier this Wednesday.
- The upbeat US ADP report fails to impress bulls or provide a fresh impetus.
- The Fed-BoJ policy divergence should act as a tailwind and help limit losses.
The pair currently trades last at 136.968.
The previous day high was 137.2 while the previous day low was 135.54. The daily 38.2% Fib levels comes at 136.56, expected to provide support. Similarly, the daily 61.8% fib level is at 136.17, expected to provide support.
The USD/JPY pair struggles to capitalize on its intraday positive move beyond the 200-day Simple Moving Average (SMA) and retreats from the 138.00 neighbourhood, or its highest level since mid-December touched earlier this Wednesday. Spot prices, however, manage to hold above the 137.00 mark through the early North American session and react little to the US macro data.
The US Dollar (USD) stands tall near a multi-month peak following the release of the better-than-expected US ADP report, which, in turn, is seen as a key factor acting as a tailwind for the USD/JPY pair. In fact, Automatic Data Processing (ADP) reported that the US private sector employers added 242K jobs in February, up sharply from the previous month’s revised reading of 119K (109K estimated originally). The data points to the underlying strength in the US labor market and might have also lifted expectations for the official jobs report, popularly known as NFP on Friday.
The markets are now pricing in a greater chance of a jumbo 50 bps lift-off at the March FOMC meeting and the bets were lifted by the overnight hawkish comments by Fed Chair Jerome Powell. This continues to lend support to the Greenback, though a combination of factors keeps a lid on any meaningful upside for the USD/JPY pair. A modest pullback in the US Treasury bond yields is holding back the USD bulls from placing fresh bets. Apart from this, a softer risk tone – amid looming recession risks – benefits the safe-haven Japanese Yen and contributes to capping the major.
The fundamental backdrop, however, still supports prospects for an extension of the USD/JPY pair’s recent upward trajectory witnessed over the past month or so. Investors seem convinced that the Bank of Japan (BoJ) will maintain the ultra-loose policy settings. It is worth mentioning that the incoming BoJ Governor Kazuo Ueda last week stressed the need to maintain the ultra-loose policy to support the fragile economy. This marks a big divergence in comparison to the Fed’s hawkish stance and validates the near-term positive outlook for the major.
Market participants now look forward to Powell’s second day of testimony before the US Congress, which, along with the US bond yields, will influence the USD price dynamics. Apart from this, the broader risk sentiment might further contribute to producing short-term trading opportunities around the USD/JPY pair. The focus will then shift to the BoJ monetary policy meeting and the release of the closely-watched US monthly employment details on Friday, which will help determine the next leg of a directional move for the major.
Technical Levels: Supports and Resistances
USDJPY currently trading at 137.24 at the time of writing. Pair opened at 137.14 and is trading with a change of 0.07 % .
| Overview | Overview.1 | |
|---|---|---|
| 0 | Today last price | 137.24 |
| 1 | Today Daily Change | 0.10 |
| 2 | Today Daily Change % | 0.07 |
| 3 | Today daily open | 137.14 |
The pair is trading above its 20 Daily moving average @ 134.57, above its 50 Daily moving average @ 132.22 , above its 100 Daily moving average @ 136.38 and below its 200 Daily moving average @ 137.4
| Trends | Trends.1 | |
|---|---|---|
| 0 | Daily SMA20 | 134.57 |
| 1 | Daily SMA50 | 132.22 |
| 2 | Daily SMA100 | 136.38 |
| 3 | Daily SMA200 | 137.40 |
The previous day high was 137.2 while the previous day low was 135.54. The daily 38.2% Fib levels comes at 136.56, expected to provide support. Similarly, the daily 61.8% fib level is at 136.17, expected to provide support.
Note the levels of interest below:
- Pivot support is noted at 136.06, 134.97, 134.4
- Pivot resistance is noted at 137.71, 138.28, 139.37
| Levels | Levels.1 |
|---|---|
| Previous Daily High | 137.20 |
| Previous Daily Low | 135.54 |
| Previous Weekly High | 137.10 |
| Previous Weekly Low | 135.26 |
| Previous Monthly High | 136.92 |
| Previous Monthly Low | 128.08 |
| Daily Fibonacci 38.2% | 136.56 |
| Daily Fibonacci 61.8% | 136.17 |
| Daily Pivot Point S1 | 136.06 |
| Daily Pivot Point S2 | 134.97 |
| Daily Pivot Point S3 | 134.40 |
| Daily Pivot Point R1 | 137.71 |
| Daily Pivot Point R2 | 138.28 |
| Daily Pivot Point R3 | 139.37 |
[/s2If]
Join Our Telegram Group
")


