#GBPUSD @ 1.18110 has resumed its downside journey as the risk of Fed’s bigger rates has propelled US yields. (Pivot Orderbook analysis)
…
This is a premium post.
[s2If !current_user_can(access_s2member_level4)]Please register for PREMIUM VERSION HERE to read full post below containing analysis. In case of any error or you think you are not able to read the full post below, please email us at support#nehcap.com [lwa][/s2If] [s2If current_user_can(access_s2member_level4)]
- GBP/USD has resumed its downside journey as the risk of Fed’s bigger rates has propelled US yields.
- Fed’s Powell sees a higher terminal rate than previously anticipated to bring down inflation.
- S&P500 futures have also resumed their downside journey, portraying that the risk-off mood is strengthening further.
The pair currently trades last at 1.18110.
The previous day high was 1.2065 while the previous day low was 1.1822. The daily 38.2% Fib levels comes at 1.1915, expected to provide resistance. Similarly, the daily 61.8% fib level is at 1.1972, expected to provide resistance.
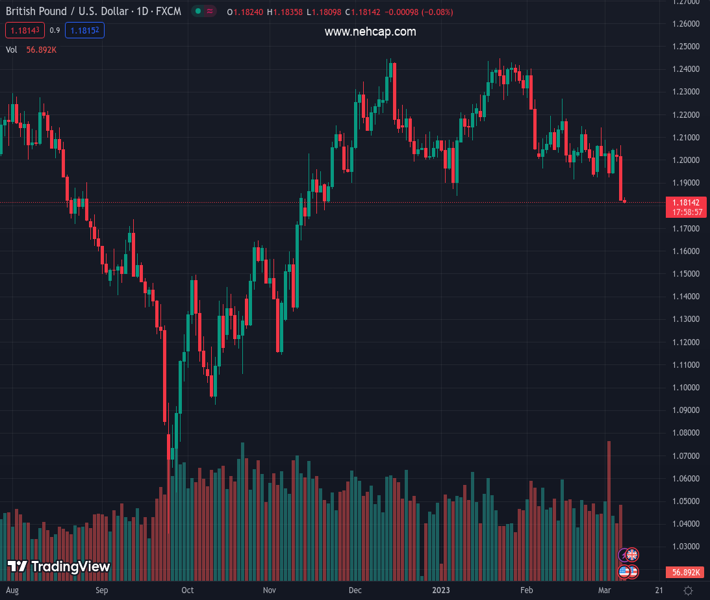
The GBP/USD pair has delivered a downside break of the consolidation formed around 1.1820 in the Asian session. The Cable has resumed its downside journey and has refreshed its day’s low at 1.1812. Rising fears of a recession in the United States have propelled returns on US government bonds. The 10-year US Treasury yields have recaptured the 4.0% resistance.
The US Dollar Index (DXY) has refreshed its three-month high above 105.80 as the Federal Reserve (Fed) chair Jerome Powell has confirmed that bigger rates are in pipeline to tame the stubborn inflation. Fed’s Powell is expecting a higher terminal rate than previously anticipated. Meanwhile, S&P500 futures have also resumed their downside journey, portraying that the risk-off mood is strengthening further.
A breakdown from the range of 1.1914-1.2150 by the Cable is followed by a large consolidation breakdown formed in the past three months. The asset is expected to continue its downside move towards the horizontal support plotted from November 08 high around 1.1600.
The 20-period Exponential Moving Average (EMA) at 1.1960 is expected to act as a major barricade for the Pound Sterling.
Also, the Relative Strength Index (RSI) (14) has slipped into the bearish range of 20.00-40.00, which indicates that the downside momentum has been triggered.
Should the Cable break below the round-level support of 1.1800, US Dollar bulls will drag the asset further toward November 17 low at 1.17633 followed by November 14 low around 1.1700.
On the flip side, a move above February 24 high at 1.2040 will drive the asset toward February 23 high around 1.2080. A breach of the latter will expose the asset to February 21 high around 1.2140.
Technical Levels: Supports and Resistances
GBPUSD currently trading at 1.1816 at the time of writing. Pair opened at 1.1828 and is trading with a change of -0.1 % .
| Overview | Overview.1 | |
|---|---|---|
| 0 | Today last price | 1.1816 |
| 1 | Today Daily Change | -0.0012 |
| 2 | Today Daily Change % | -0.1000 |
| 3 | Today daily open | 1.1828 |
The pair remains strongly bearish on the daily time frame. It trades below the 20 SMA @ 1.2036, 50 SMA 1.2136, 100 SMA @ 1.1997 and 200 SMA @ 1.1909.
| Trends | Trends.1 | |
|---|---|---|
| 0 | Daily SMA20 | 1.2036 |
| 1 | Daily SMA50 | 1.2136 |
| 2 | Daily SMA100 | 1.1997 |
| 3 | Daily SMA200 | 1.1909 |
The previous day high was 1.2065 while the previous day low was 1.1822. The daily 38.2% Fib levels comes at 1.1915, expected to provide resistance. Similarly, the daily 61.8% fib level is at 1.1972, expected to provide resistance.
Note the levels of interest below:
- Pivot support is noted at 1.1745, 1.1661, 1.1501
- Pivot resistance is noted at 1.1988, 1.2148, 1.2231
| Levels | Levels.1 |
|---|---|
| Previous Daily High | 1.2065 |
| Previous Daily Low | 1.1822 |
| Previous Weekly High | 1.2143 |
| Previous Weekly Low | 1.1922 |
| Previous Monthly High | 1.2402 |
| Previous Monthly Low | 1.1915 |
| Daily Fibonacci 38.2% | 1.1915 |
| Daily Fibonacci 61.8% | 1.1972 |
| Daily Pivot Point S1 | 1.1745 |
| Daily Pivot Point S2 | 1.1661 |
| Daily Pivot Point S3 | 1.1501 |
| Daily Pivot Point R1 | 1.1988 |
| Daily Pivot Point R2 | 1.2148 |
| Daily Pivot Point R3 | 1.2231 |
[/s2If]
Join Our Telegram Group
")


