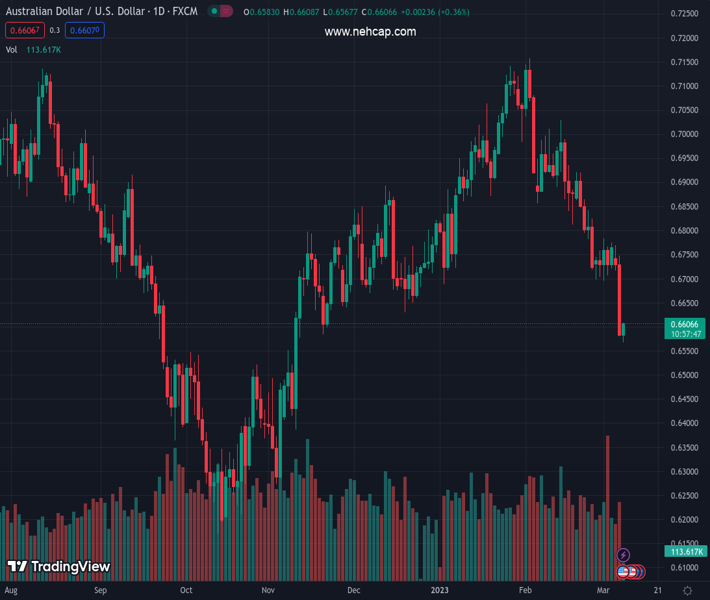
#AUDUSD @ 0.66051 bounces off a four-month low, though any meaningful recovery seems elusive. (Pivot Orderbook analysis)
…
This is a premium post.
[s2If !current_user_can(access_s2member_level4)]Please register for PREMIUM VERSION HERE to read full post below containing analysis. In case of any error or you think you are not able to read the full post below, please email us at support#nehcap.com [lwa][/s2If] [s2If current_user_can(access_s2member_level4)]
- AUD/USD bounces off a four-month low, though any meaningful recovery seems elusive.
- RBA’s dovish shift, looming recession risks could cap gains for the risk-sensitive Aussie.
- Bets for aggressive rate hikes by the Fed underpin the USD and should act as a headwind.
The pair currently trades last at 0.66051.
The previous day high was 0.6748 while the previous day low was 0.6581. The daily 38.2% Fib levels comes at 0.6645, expected to provide resistance. Similarly, the daily 61.8% fib level is at 0.6684, expected to provide resistance.
The AUD/USD pair stages a modest intraday recovery from a nearly four-month low touched earlier this Wednesday and builds on its steady intraday ascent through the first half of the European session. The pair climbs back above the 0.6600 mark and reverses a part of the previous day’s Reserve Bank of Australia (RBA)-inspired losses, though the fundamental backdrop still seems tilted in favour of bearish traders.
Against the backdrop of RBA’s dovish shift on Tuesday, the prevalent strong bullish sentiment surrounding the US Dollar adds credence to the negative outlook for the AUD/USD pair. It is worth recalling that the Australian central bank signalled that it might be nearing the end of its rate-hiking cycle. In contrast, Federal Reserve Chair Jerome Powell indicated that interest rates might need to go up faster and higher than previously anticipated.
In the prepared remarks for his semi-annual testimony to Congress, Powell added that the Fed is prepared to increase the pace of rate hikes to combat stubbornly high inflation. This, in turn, lifted bets for a jumbo 50 bps lift-off at the March FOMC meeting and remains supportive of elevated US Treasury bond yields. In fact, the rate-sensitive two-year US Treasury note jumps to its highest level since 2007 and pushes the USD to a three-month peak.
Furthermore, the yield on the benchmark 10-year US government bond holds steady near the 4.0% mark and fuels worries about economic headwinds stemming from rapidly rising borrowing costs. This, along with fading optimism over a strong economic recovery in China and US-China tensions, continues to weigh on investors; sentiment and suggests that the path of least resistance for the risk-sensitive Aussie remains to the downside.
Hence, any subsequent move-up might be seen as an opportunity to initiate fresh bearish positions around the AUD/USD pair and runs the risk of fizzling out rather quickly. Traders now look to the US economic docket, featuring the ADP report and JOLTS Job Openings data. This, along with Powell’s second day of congressional testimony, the US bond yields and the broader risk sentiment, will influence the USD and provide a fresh impetus.
Technical Levels: Supports and Resistances
AUDUSD currently trading at 0.6603 at the time of writing. Pair opened at 0.6592 and is trading with a change of 0.17 % .
| Overview | Overview.1 | |
|---|---|---|
| 0 | Today last price | 0.6603 |
| 1 | Today Daily Change | 0.0011 |
| 2 | Today Daily Change % | 0.1700 |
| 3 | Today daily open | 0.6592 |
The pair remains strongly bearish on the daily time frame. It trades below the 20 SMA @ 0.6828, 50 SMA 0.6896, 100 SMA @ 0.6757 and 200 SMA @ 0.6787.
| Trends | Trends.1 | |
|---|---|---|
| 0 | Daily SMA20 | 0.6828 |
| 1 | Daily SMA50 | 0.6896 |
| 2 | Daily SMA100 | 0.6757 |
| 3 | Daily SMA200 | 0.6787 |
The previous day high was 0.6748 while the previous day low was 0.6581. The daily 38.2% Fib levels comes at 0.6645, expected to provide resistance. Similarly, the daily 61.8% fib level is at 0.6684, expected to provide resistance.
Note the levels of interest below:
- Pivot support is noted at 0.6533, 0.6474, 0.6366
- Pivot resistance is noted at 0.6699, 0.6807, 0.6866
| Levels | Levels.1 |
|---|---|
| Previous Daily High | 0.6748 |
| Previous Daily Low | 0.6581 |
| Previous Weekly High | 0.6784 |
| Previous Weekly Low | 0.6695 |
| Previous Monthly High | 0.7158 |
| Previous Monthly Low | 0.6698 |
| Daily Fibonacci 38.2% | 0.6645 |
| Daily Fibonacci 61.8% | 0.6684 |
| Daily Pivot Point S1 | 0.6533 |
| Daily Pivot Point S2 | 0.6474 |
| Daily Pivot Point S3 | 0.6366 |
| Daily Pivot Point R1 | 0.6699 |
| Daily Pivot Point R2 | 0.6807 |
| Daily Pivot Point R3 | 0.6866 |
[/s2If]
Join Our Telegram Group
")


