#AUDUSD @ 0.65912 picks up bids to pare the biggest daily loss in a month., @nehcap view: Limited recovery expected (Pivot Orderbook analysis)
…
This is a premium post.
[s2If !current_user_can(access_s2member_level4)]Please register for PREMIUM VERSION HERE to read full post below containing analysis. In case of any error or you think you are not able to read the full post below, please email us at support#nehcap.com [lwa][/s2If] [s2If current_user_can(access_s2member_level4)]
- AUD/USD picks up bids to pare the biggest daily loss in a month.
- Short-term support line joins oversold RSI (14) to trigger corrective rebound.
- Previous support line from February, 50-SMA restrict recovery moves.
- Multiple levels to prod the Aussie pair bears around 0.6540-20 region.
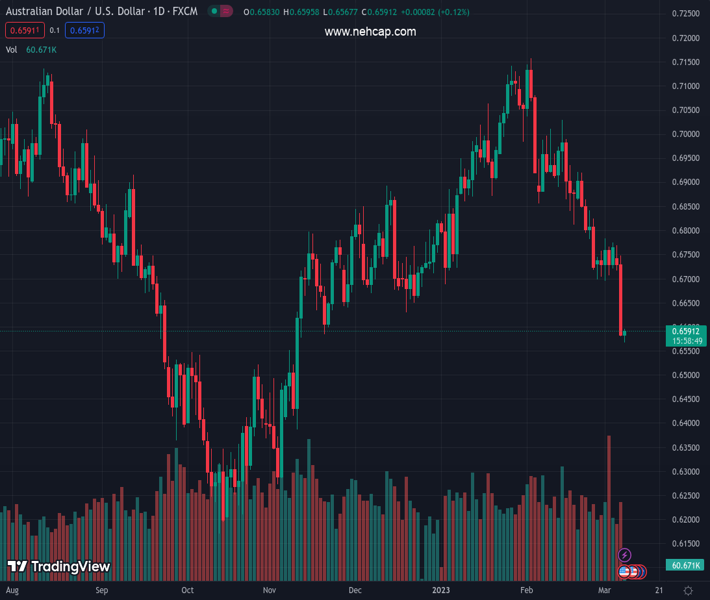
The pair currently trades last at 0.65912.
The previous day high was 0.6748 while the previous day low was 0.6581. The daily 38.2% Fib levels comes at 0.6645, expected to provide resistance. Similarly, the daily 61.8% fib level is at 0.6684, expected to provide resistance.
AUD/USD recovers from a four-month low surrounding 0.6565 as it approaches the 0.6600 threshold heading into Wednesday’s European session, poking 0.6595 by the press time.
In doing so, the Aussie pair bounce off a two-week-old descending support line while paring the biggest daily loss since February 03.
Not only the downward-sloping support line from February 17 but the oversold RSI (14) also puts a floor under the AUD/USD price.
The recovery moves, however, remain elusive as the previous support line from February 06, close to 0.6625 at the latest, guards the pair’s nearby upside. Following that, the 50-SMA hurdle surrounding 0.6725 can challenge the AUD/USD buyers.
It should be noted that the upside break of 0.6725 isn’t an open invitation to the AUD/USD bulls as the monthly high near 0.6775 appears the key hurdle.
Meanwhile, a downside break of the aforementioned support line, close to 0.6565 at the latest, could drag the Aussie prices towards the 0.6540-20 support zone as multiple levels marked in October 2022 might challenge the bears afterward.
In a case where the AUD/USD pair remains bearish past 0.6520, the odds of witnessing a slump toward the previous yearly low surrounding 0.6170 can’t be ruled out.
Trend: Limited recovery expected
Technical Levels: Supports and Resistances
AUDUSD currently trading at 0.6589 at the time of writing. Pair opened at 0.6592 and is trading with a change of -0.05% % .
| Overview | Overview.1 | |
|---|---|---|
| 0 | Today last price | 0.6589 |
| 1 | Today Daily Change | -0.0003 |
| 2 | Today Daily Change % | -0.05% |
| 3 | Today daily open | 0.6592 |
The pair remains strongly bearish on the daily time frame. It trades below the 20 SMA @ 0.6828, 50 SMA 0.6896, 100 SMA @ 0.6757 and 200 SMA @ 0.6787.
| Trends | Trends.1 | |
|---|---|---|
| 0 | Daily SMA20 | 0.6828 |
| 1 | Daily SMA50 | 0.6896 |
| 2 | Daily SMA100 | 0.6757 |
| 3 | Daily SMA200 | 0.6787 |
The previous day high was 0.6748 while the previous day low was 0.6581. The daily 38.2% Fib levels comes at 0.6645, expected to provide resistance. Similarly, the daily 61.8% fib level is at 0.6684, expected to provide resistance.
Note the levels of interest below:
- Pivot support is noted at 0.6533, 0.6474, 0.6366
- Pivot resistance is noted at 0.6699, 0.6807, 0.6866
| Levels | Levels.1 |
|---|---|
| Previous Daily High | 0.6748 |
| Previous Daily Low | 0.6581 |
| Previous Weekly High | 0.6784 |
| Previous Weekly Low | 0.6695 |
| Previous Monthly High | 0.7158 |
| Previous Monthly Low | 0.6698 |
| Daily Fibonacci 38.2% | 0.6645 |
| Daily Fibonacci 61.8% | 0.6684 |
| Daily Pivot Point S1 | 0.6533 |
| Daily Pivot Point S2 | 0.6474 |
| Daily Pivot Point S3 | 0.6366 |
| Daily Pivot Point R1 | 0.6699 |
| Daily Pivot Point R2 | 0.6807 |
| Daily Pivot Point R3 | 0.6866 |
[/s2If]
Join Our Telegram Group
")


