WTI drops more than 4% or more than $3.00 pb on Tuesday. (Pivot Orderbook analysis)
…
This is a premium post.
[s2If !current_user_can(access_s2member_level4)]Please register for PREMIUM VERSION HERE to read full post below containing analysis. In case of any error or you think you are not able to read the full post below, please email us at support#nehcap.com [lwa][/s2If] [s2If current_user_can(access_s2member_level4)]
- WTI drops more than 4% or more than $3.00 pb on Tuesday.
- Powell opened the door for faster rate hikes and higher terminal rates.
- China’s reopening put a lid on WTI’s fall, at around the 20-day EMA at $77.21.
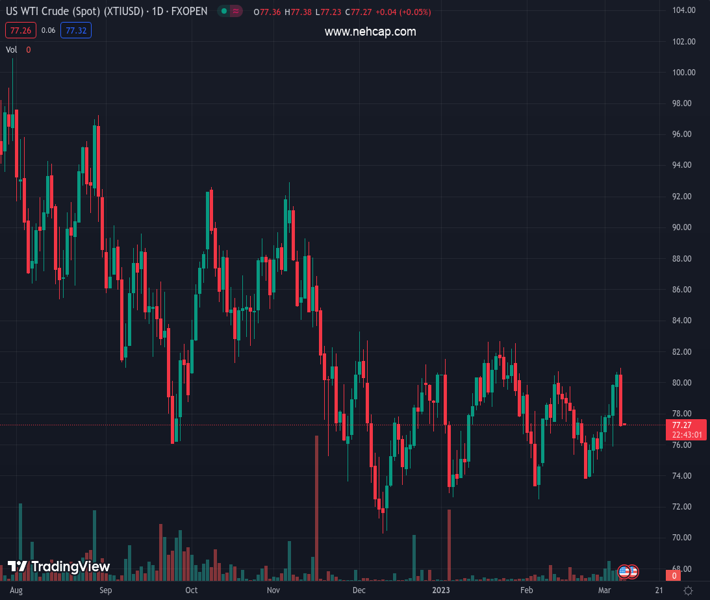
The pair currently trades last at 77.28.
The previous day high was 80.68 while the previous day low was 78.4. The daily 38.2% Fib levels comes at 79.81, expected to provide resistance. Similarly, the daily 61.8% fib level is at 79.27, expected to provide resistance.
Western Texas Intermediate (WTI) collapsed 4% on Tuesday, following hawkish remarks by the US Federal Reserve (Fed) Chair Jerome Powell at an appearance in the US Senate. The US Dollar (USD) rose, and US Treasury bond yields, mainly 2s, reached the 5% threshold. At the time of typing, WTI is exchanging hands at $77.17 PB.
Jerome Powell, the Federal Reserve Chair, said the Fed needs to increase rates above previous forecasts. Powell added that the US central bank would be ready to hike rates in large increments if upcoming data was solid.
The US Dollar Index (DXY), a gauge for the buck’s value vs. six currencies, advances more than 1%, at 105.597, a headwind for the US Dollar denominated commodity.
Oil prices tumbled earlier on China’s data, with Exports shrinking 6.8% YoY, lower than the previous reading. Imports were 10.2% weaker, worst than December figures at 7.5%, less than a year earlier.
However, WTI’s fall was capped by speculations of an oil shortage. According to the US Energy Information Administration (EIA), US crude production and demand will increase in 2023 as Chinese travel drives consumption.
Technical Levels: Supports and Resistances
XTIUSD currently trading at 77.28 at the time of writing. Pair opened at 80.66 and is trading with a change of -4.19 % .
| Overview | Overview.1 | |
|---|---|---|
| 0 | Today last price | 77.28 |
| 1 | Today Daily Change | -3.38 |
| 2 | Today Daily Change % | -4.19 |
| 3 | Today daily open | 80.66 |
The pair remains strongly bearish on the daily time frame. It trades below the 20 SMA @ 77.76, 50 SMA 78.05, 100 SMA @ 79.74 and 200 SMA @ 87.58.
| Trends | Trends.1 | |
|---|---|---|
| 0 | Daily SMA20 | 77.76 |
| 1 | Daily SMA50 | 78.05 |
| 2 | Daily SMA100 | 79.74 |
| 3 | Daily SMA200 | 87.58 |
The previous day high was 80.68 while the previous day low was 78.4. The daily 38.2% Fib levels comes at 79.81, expected to provide resistance. Similarly, the daily 61.8% fib level is at 79.27, expected to provide resistance.
Note the levels of interest below:
- Pivot support is noted at 79.14, 77.62, 76.85
- Pivot resistance is noted at 81.43, 82.2, 83.72
| Levels | Levels.1 |
|---|---|
| Previous Daily High | 80.68 |
| Previous Daily Low | 78.40 |
| Previous Weekly High | 79.93 |
| Previous Weekly Low | 75.05 |
| Previous Monthly High | 80.75 |
| Previous Monthly Low | 72.50 |
| Daily Fibonacci 38.2% | 79.81 |
| Daily Fibonacci 61.8% | 79.27 |
| Daily Pivot Point S1 | 79.14 |
| Daily Pivot Point S2 | 77.62 |
| Daily Pivot Point S3 | 76.85 |
| Daily Pivot Point R1 | 81.43 |
| Daily Pivot Point R2 | 82.20 |
| Daily Pivot Point R3 | 83.72 |
[/s2If]
Join Our Telegram Group
")


