#USDCAD @ 1.37495 climbs past the 1.3700 figure on Powell’s hawkish stance, (Pivot Orderbook analysis)
…
This is a premium post.
[s2If !current_user_can(access_s2member_level4)]Please register for PREMIUM VERSION HERE to read full post below containing analysis. In case of any error or you think you are not able to read the full post below, please email us at support#nehcap.com [lwa][/s2If] [s2If current_user_can(access_s2member_level4)]
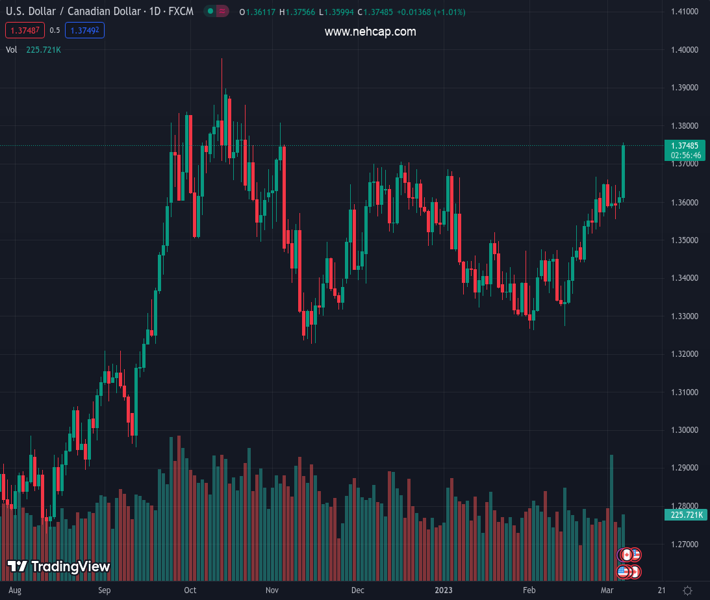
- USD/CAD climbs past the 1.3700 figure on Powell’s hawkish stance,
- USD/CAD Price Analysis: Buyers are eyeing 1.3800 after trading at 4-month highs.
The pair currently trades last at 1.37495.
The previous day high was 1.3629 while the previous day low was 1.3582. The daily 38.2% Fib levels comes at 1.3611, expected to provide support. Similarly, the daily 61.8% fib level is at 1.36, expected to provide support.
The USD/CAD rallied to fresh YTD highs at 1.3743 on the US Federal Reserve’s (Fed) Chair Jerome Powell’s comments. Powell added that inflation is high and the Fed could tighten monetary conditions faster depending on the incoming data. Therefore, the USD/CAD jumped from around 1.3670. A the time of writing, the USD/CAD exchanges hands at 1.3744.
The USD/CAD has extended its gains past the 130 pips in the day, with bulls eyeing to test the November 3 high, which confluences with an upslope trendline that passes around 1.3808. If the USD/CAD pierces the latter, that wound put into play a test of 2022 high at 1.3977. But first, buyers need to reclaim 1.3900, followed by the latter and the psychological 1.4000 mark.
In an alternate scenario, the USD/CAD first support would be the 1.3700 figure for a bearish continuation, followed by the prior’s YTD high at 1.3685. Once cleared, the USD/CAD next support would be March 3, daily low at 1.3550.
It should be noted that the Relative Strength Index (RSI) in bullish territory suggests that bulls are in charge, further cemented by the Rate of Change (RoC) aiming higher.
Technical Levels: Supports and Resistances
USDCAD currently trading at 1.3744 at the time of writing. Pair opened at 1.3616 and is trading with a change of 0.94 % .
| Overview | Overview.1 | |
|---|---|---|
| 0 | Today last price | 1.3744 |
| 1 | Today Daily Change | 0.0128 |
| 2 | Today Daily Change % | 0.9400 |
| 3 | Today daily open | 1.3616 |
The pair remains strongly bullish on the daily timeframe. It trades above its 20 SMA @ 1.3499, 50 SMA 1.346, 100 SMA @ 1.3501 and 200 SMA @ 1.3289.
| Trends | Trends.1 | |
|---|---|---|
| 0 | Daily SMA20 | 1.3499 |
| 1 | Daily SMA50 | 1.3460 |
| 2 | Daily SMA100 | 1.3501 |
| 3 | Daily SMA200 | 1.3289 |
The previous day high was 1.3629 while the previous day low was 1.3582. The daily 38.2% Fib levels comes at 1.3611, expected to provide support. Similarly, the daily 61.8% fib level is at 1.36, expected to provide support.
Note the levels of interest below:
- Pivot support is noted at 1.3589, 1.3562, 1.3543
- Pivot resistance is noted at 1.3636, 1.3656, 1.3683
| Levels | Levels.1 |
|---|---|
| Previous Daily High | 1.3629 |
| Previous Daily Low | 1.3582 |
| Previous Weekly High | 1.3659 |
| Previous Weekly Low | 1.3534 |
| Previous Monthly High | 1.3666 |
| Previous Monthly Low | 1.3262 |
| Daily Fibonacci 38.2% | 1.3611 |
| Daily Fibonacci 61.8% | 1.3600 |
| Daily Pivot Point S1 | 1.3589 |
| Daily Pivot Point S2 | 1.3562 |
| Daily Pivot Point S3 | 1.3543 |
| Daily Pivot Point R1 | 1.3636 |
| Daily Pivot Point R2 | 1.3656 |
| Daily Pivot Point R3 | 1.3683 |
[/s2If]
Join Our Telegram Group
")


