#EURUSD @ 1.05507 bears take a breather after posting the biggest daily slump since late September 2022., @nehcap view: Further downside expected (Pivot Orderbook analysis)
…
This is a premium post.
[s2If !current_user_can(access_s2member_level4)]Please register for PREMIUM VERSION HERE to read full post below containing analysis. In case of any error or you think you are not able to read the full post below, please email us at support#nehcap.com [lwa][/s2If] [s2If current_user_can(access_s2member_level4)]
- EUR/USD bears take a breather after posting the biggest daily slump since late September 2022.
- Failure to cross a fortnight-long horizontal resistance joins bearish MACD signals to favor Euro sellers.
- Upward-sloping support line from early January 2023 appears the last defense of EUR/USD buyers.
- Bulls need validation from 200-SMA to retake control.
The pair currently trades last at 1.05507.
The previous day high was 1.0694 while the previous day low was 1.0622. The daily 38.2% Fib levels comes at 1.0667, expected to provide resistance. Similarly, the daily 61.8% fib level is at 1.065, expected to provide resistance.
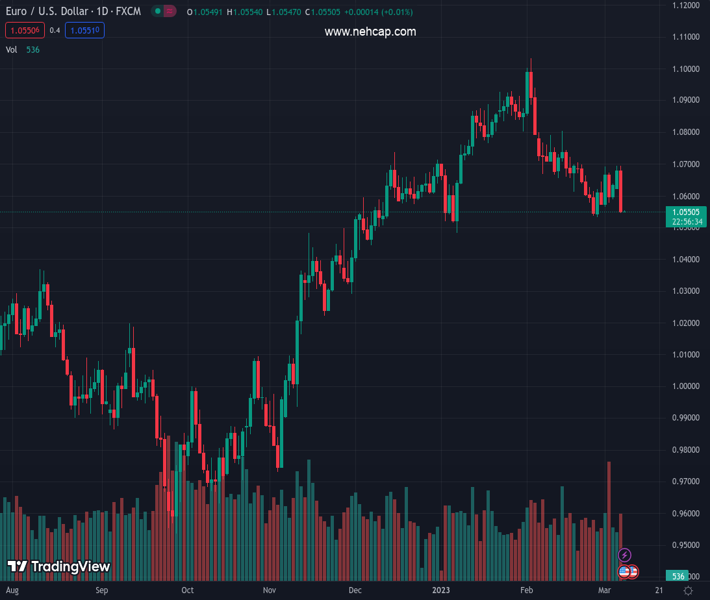
EUR/USD remains pressured around the lowest levels in a week, making rounds to 1.0550-45 after falling the most in nearly 3.5 months the previous day. That said, the major currency pair snapped a two-day winning streak while posting a U-turn from the 13-day-long horizontal hurdle, as well as pleasing the bears, the previous day.
Not only the quote’s U-turn from the short-term key horizontal resistance, around 1.0690-700 but the bearish MACD signals and sustained trading below the 200-SMA also keeps the EUR/USD sellers hopeful.
That said, an upward-sloping support line from early January, currently around 1.0540, appears the immediate challenge for the Euro bears to tackle.
Following that, the previous monthly low surrounding 1.0530 may act as an intermediate halt during the fall towards the January 2023 bottom of 1.0483.
In a case where EUR/USD remains bearish past 1.0483, a late December 2022 trough near 1.0445 could act as an extra downside filter.
On the flip side, a clear break of the aforementioned horizontal hurdle near 1.0690-700 becomes necessary to convince the Euro buyers.
Even so, the 200-bar Simple Moving Average (SMA), close to 1.0735 by the press time, could act as a validation point for the EUR/USD pair’s further advances.
Trend: Further downside expected
Technical Levels: Supports and Resistances
EURUSD currently trading at 1.0549 at the time of writing. Pair opened at 1.0677 and is trading with a change of -1.20% % .
| Overview | Overview.1 | |
|---|---|---|
| 0 | Today last price | 1.0549 |
| 1 | Today Daily Change | -0.0128 |
| 2 | Today Daily Change % | -1.20% |
| 3 | Today daily open | 1.0677 |
The pair is trading below its 20 Daily moving average @ 1.0661, below its 50 Daily moving average @ 1.0728 , above its 100 Daily moving average @ 1.0504 and above its 200 Daily moving average @ 1.0328
| Trends | Trends.1 | |
|---|---|---|
| 0 | Daily SMA20 | 1.0661 |
| 1 | Daily SMA50 | 1.0728 |
| 2 | Daily SMA100 | 1.0504 |
| 3 | Daily SMA200 | 1.0328 |
The previous day high was 1.0694 while the previous day low was 1.0622. The daily 38.2% Fib levels comes at 1.0667, expected to provide resistance. Similarly, the daily 61.8% fib level is at 1.065, expected to provide resistance.
Note the levels of interest below:
- Pivot support is noted at 1.0635, 1.0593, 1.0563
- Pivot resistance is noted at 1.0707, 1.0737, 1.0779
| Levels | Levels.1 |
|---|---|
| Previous Daily High | 1.0694 |
| Previous Daily Low | 1.0622 |
| Previous Weekly High | 1.0692 |
| Previous Weekly Low | 1.0533 |
| Previous Monthly High | 1.1033 |
| Previous Monthly Low | 1.0533 |
| Daily Fibonacci 38.2% | 1.0667 |
| Daily Fibonacci 61.8% | 1.0650 |
| Daily Pivot Point S1 | 1.0635 |
| Daily Pivot Point S2 | 1.0593 |
| Daily Pivot Point S3 | 1.0563 |
| Daily Pivot Point R1 | 1.0707 |
| Daily Pivot Point R2 | 1.0737 |
| Daily Pivot Point R3 | 1.0779 |
[/s2If]
Join Our Telegram Group
")


