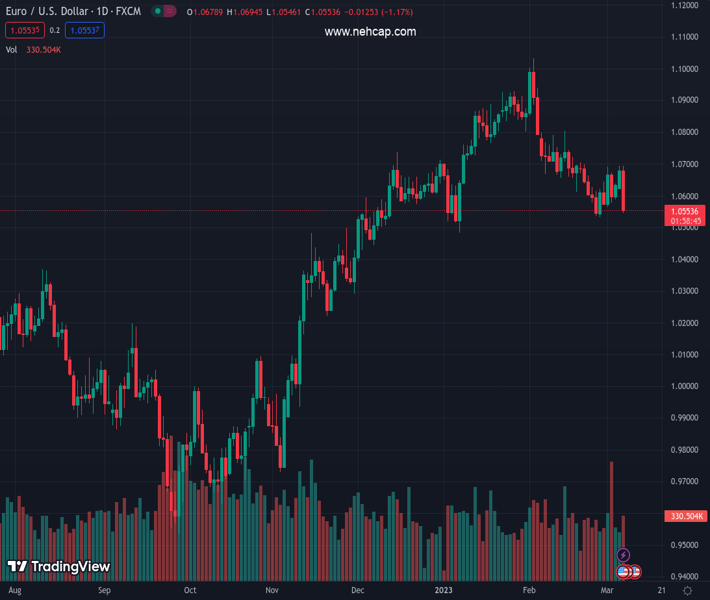
#EURUSD @ 1.05503 has been falling throughout the day on the back of an uber-hawkish Fed. (Pivot Orderbook analysis)
…
This is a premium post.
[s2If !current_user_can(access_s2member_level4)]Please register for PREMIUM VERSION HERE to read full post below containing analysis. In case of any error or you think you are not able to read the full post below, please email us at support#nehcap.com [lwa][/s2If] [s2If current_user_can(access_s2member_level4)]
- EUR/USD has been falling throughout the day on the back of an uber-hawkish Fed.
- Fed’s Powell testified to Congress and the US Dollar took-off.
The pair currently trades last at 1.05503.
The previous day high was 1.0694 while the previous day low was 1.0622. The daily 38.2% Fib levels comes at 1.0667, expected to provide resistance. Similarly, the daily 61.8% fib level is at 1.065, expected to provide resistance.
EUR/USD keeps falling as we move into late US trade in what has been a maximum drop in the single currency following uber-hawkish rhetoric from the Federal Reserve’s chairman on Tuesday who testified to Congress.
The main words that got the US Dollar going coming from the Fed’s chair Powell were, “the latest economic data have come in stronger than expected, which suggests that the ultimate level of interest rates is likely to be higher than previously anticipated. If the totality of the data were to indicate that faster tightening is warranted, we would be prepared to increase the pace of rate hikes.”
As a consequence, the yield on the US 10-year Treasury note rose to 4% before easing back to 3.96%, remaining marginally below the three-month high of 4.07% touched on March 2nd as investors assessed the pace of future rate hikes by the Federal Reserve. This gave the greenback a boost. The DXY index, a measure of the US Dollar vs. a basket of currencies, vaulted 105 the figure in a move that started out from 104.43 and kept going until 105.435.
Meanwhile, the Euro is likely to be hamstrung as Germany may still suffer a technical recession in Q4 2022/Q1 2023. However, analysts at Rabobank argued that ”at least more recent data are indicating resilience in the economy.” On the other hand, the analysts also said, ‘resilient’ is not ‘strong’ and ”the market is facing these data releases with longer EUR positions than at the end of last year. This suggests that the hawkish rhetoric of the ECB may struggle to coax the EUR significantly higher particularly given the recent buoyancy of the greenback.”
Of note, inflation remains stubbornly high in the Euro Area which was evident from the February inflation numbers. Officials, such as ECB’s Pierre Wunsch indicated that it was not unreasonable to expect ECB to hike to 4%. ECB policymaker Klaas Knot said on Tuesday that the ECB can be expected to keep raising interest rates for “quite some time” after March. Knot said that the current pace of hikes could continue into May if underlying inflation does not materially abate. “Once we see a clear, decisive turn in underlying inflation dynamics, I expect the ECB to move to smaller steps.”
Knot also argued that inflation appears to have peaked. The sharp decrease in energy prices seen over the last months could bring down headline inflation even faster than what the ECB is projecting, the policymaker added. He does not see a recession in the winter and pointed out that the slowdown in economic growth seems “even more shallow, short-lived than expected”.
Technical Levels: Supports and Resistances
EURUSD currently trading at 1.0554 at the time of writing. Pair opened at 1.0677 and is trading with a change of -1.15 % .
| Overview | Overview.1 | |
|---|---|---|
| 0 | Today last price | 1.0554 |
| 1 | Today Daily Change | -0.0123 |
| 2 | Today Daily Change % | -1.1500 |
| 3 | Today daily open | 1.0677 |
The pair is trading below its 20 Daily moving average @ 1.0661, below its 50 Daily moving average @ 1.0728 , above its 100 Daily moving average @ 1.0504 and above its 200 Daily moving average @ 1.0328
| Trends | Trends.1 | |
|---|---|---|
| 0 | Daily SMA20 | 1.0661 |
| 1 | Daily SMA50 | 1.0728 |
| 2 | Daily SMA100 | 1.0504 |
| 3 | Daily SMA200 | 1.0328 |
The previous day high was 1.0694 while the previous day low was 1.0622. The daily 38.2% Fib levels comes at 1.0667, expected to provide resistance. Similarly, the daily 61.8% fib level is at 1.065, expected to provide resistance.
Note the levels of interest below:
- Pivot support is noted at 1.0635, 1.0593, 1.0563
- Pivot resistance is noted at 1.0707, 1.0737, 1.0779
| Levels | Levels.1 |
|---|---|
| Previous Daily High | 1.0694 |
| Previous Daily Low | 1.0622 |
| Previous Weekly High | 1.0692 |
| Previous Weekly Low | 1.0533 |
| Previous Monthly High | 1.1033 |
| Previous Monthly Low | 1.0533 |
| Daily Fibonacci 38.2% | 1.0667 |
| Daily Fibonacci 61.8% | 1.0650 |
| Daily Pivot Point S1 | 1.0635 |
| Daily Pivot Point S2 | 1.0593 |
| Daily Pivot Point S3 | 1.0563 |
| Daily Pivot Point R1 | 1.0707 |
| Daily Pivot Point R2 | 1.0737 |
| Daily Pivot Point R3 | 1.0779 |
[/s2If]
Join Our Telegram Group
")


