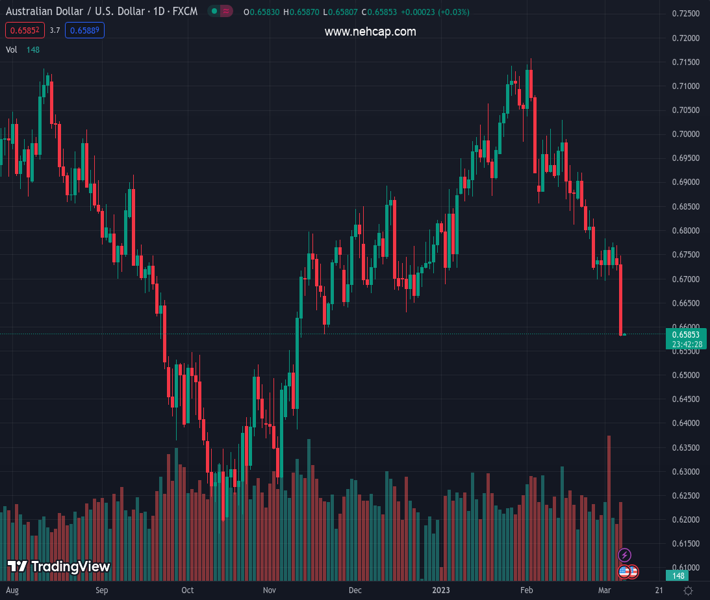
#AUDUSD @ 0.65848 licks its wounds at multi-day low after falling the most in a month. (Pivot Orderbook analysis)
…
This is a premium post.
[s2If !current_user_can(access_s2member_level4)]Please register for PREMIUM VERSION HERE to read full post below containing analysis. In case of any error or you think you are not able to read the full post below, please email us at support#nehcap.com [lwa][/s2If] [s2If current_user_can(access_s2member_level4)]
- AUD/USD licks its wounds at multi-day low after falling the most in a month.
- RBA’s Lowe hints at a pause in rate hike after the central bank signalled peak in inflation.
- Fed’s Powell appears hawkish and bolstered case for 50 bp rate hike in March.
- Challenges to sentiment from China exert more downside pressure on Aussie price.
The pair currently trades last at 0.65848.
The previous day high was 0.677 while the previous day low was 0.6716. The daily 38.2% Fib levels comes at 0.6737, expected to provide resistance. Similarly, the daily 61.8% fib level is at 0.6749, expected to provide resistance.
AUD/USD holds lower grounds near 0.6585-80, the lowest levels since early November 2022, showing little reaction to Reserve Bank of Australia (RBA) Governor Philip Lowe’s dovish remarks during early Wednesday. The reason could be linked to the previous day’s RBA statement that already revealed the dovish bias of the Aussie central bank, as well as the bear’s taking of a breather after posting the biggest daily slump in a month.
RBA’s Lowe said on Wednesday that it was closer to pausing its aggressive cycle of rate increases as the policy was now in the restrictive territory and there were signs the economy was responding.
Also read: RBA’s Lowe: Closer To Pausing On Rate Hikes
Previously, RBA matched market forecasts of lifting the benchmark interest rate by 25 basis points (bps) to 3.60%. The Aussie central bank even said that the RBA expects further monetary tightening will be needed. However, the RBA Statement saying that the Consumer Price Index (CPI) indicator hints at the inflation peak seemed to have weighed on the AUD/USD prices upon the announcements.
More importantly, hawkish comments from Federal Reserve (Fed) Chairman Jerome Powell in his Semi-Annual Testimony to the US Congress propelled the market’s risk-off mood, as well as the bets of a 50 bp Fed rate hike in March, which in turn drowned the AUD/USD prices.
It’s worth noting that the fresh US-China tensions are extra burden for the risk-barometer pair help in weighing on the price at the multi-day low. The anticipated meeting of the US and Taiwanese Officials could be cited as the key reason for the same. On the same line, China’s new Foreign Minister, Qin Gang, said that they resolutely oppose all forms of hegemony, cold war mentality. The same indirectly criticizes the US pressure and criticism for the China-Russia ties and escalated the fears of a fresh round of Sino-American tensions. Further, Financial Times (FT) headlines suggesting China’s lowest growth target in decades signals a new era of caution.
Looking ahead, the round of Fed Chair Jerome Powell and the US ADP Employment Change, the early signal for Friday’s US Nonfarm Payrolls (NFP) will be in focus. Also important to watch will be the risk catalysts surrounding China and movements of the bond market.
A clear downside break of a one-month-old descending support line, now immediate resistance around 0.6625, directs AUD/USD towards the October 2022 peak surrounding 0.6545.
Technical Levels: Supports and Resistances
AUDUSD currently trading at 0.6584 at the time of writing. Pair opened at 0.6727 and is trading with a change of -2.13% % .
| Overview | Overview.1 | |
|---|---|---|
| 0 | Today last price | 0.6584 |
| 1 | Today Daily Change | -0.0143 |
| 2 | Today Daily Change % | -2.13% |
| 3 | Today daily open | 0.6727 |
The pair remains strongly bearish on the daily time frame. It trades below the 20 SMA @ 0.6846, 50 SMA 0.6899, 100 SMA @ 0.6754 and 200 SMA @ 0.679.
| Trends | Trends.1 | |
|---|---|---|
| 0 | Daily SMA20 | 0.6846 |
| 1 | Daily SMA50 | 0.6899 |
| 2 | Daily SMA100 | 0.6754 |
| 3 | Daily SMA200 | 0.6790 |
The previous day high was 0.677 while the previous day low was 0.6716. The daily 38.2% Fib levels comes at 0.6737, expected to provide resistance. Similarly, the daily 61.8% fib level is at 0.6749, expected to provide resistance.
Note the levels of interest below:
- Pivot support is noted at 0.6706, 0.6684, 0.6653
- Pivot resistance is noted at 0.6759, 0.6791, 0.6812
| Levels | Levels.1 |
|---|---|
| Previous Daily High | 0.6770 |
| Previous Daily Low | 0.6716 |
| Previous Weekly High | 0.6784 |
| Previous Weekly Low | 0.6695 |
| Previous Monthly High | 0.7158 |
| Previous Monthly Low | 0.6698 |
| Daily Fibonacci 38.2% | 0.6737 |
| Daily Fibonacci 61.8% | 0.6749 |
| Daily Pivot Point S1 | 0.6706 |
| Daily Pivot Point S2 | 0.6684 |
| Daily Pivot Point S3 | 0.6653 |
| Daily Pivot Point R1 | 0.6759 |
| Daily Pivot Point R2 | 0.6791 |
| Daily Pivot Point R3 | 0.6812 |
[/s2If]
Join Our Telegram Group
")


