#XAGUSD @ 20.903 Silver price snaps two-day winning streak, renews intraday low of late., @nehcap view: Limited downside expected (Pivot Orderbook analysis)
…
This is a premium post.
[s2If !current_user_can(access_s2member_level4)]Please register for PREMIUM VERSION HERE to read full post below containing analysis. In case of any error or you think you are not able to read the full post below, please email us at support#nehcap.com [lwa][/s2If] [s2If current_user_can(access_s2member_level4)]
- Silver price snaps two-day winning streak, renews intraday low of late.
- Clear U-turn from 200-DMA, bearish MACD signals hint at XAG/USD’s further downside.
- Three-week-old descending resistance line, horizontal area from the last December also challenge Silver buyers.
- Six-month-long upward-sloping trend line can restrict XAG/USD downside amid nearly oversold RSI (14).
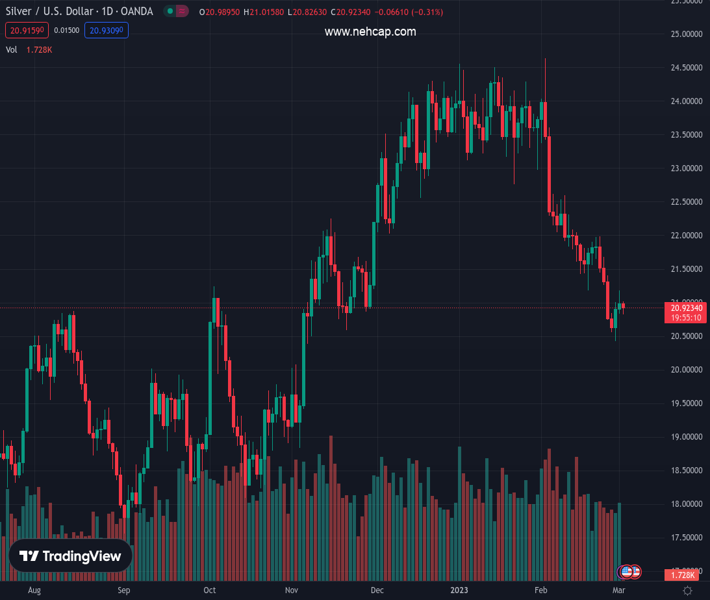
The pair currently trades last at 20.903.
The previous day high was 21.18 while the previous day low was 20.84. The daily 38.2% Fib levels comes at 21.05, expected to provide resistance. Similarly, the daily 61.8% fib level is at 20.97, expected to provide resistance.
Silver price (XAG/USD) takes offers to refresh intraday low near $20.90 as it prints the first daily loss in three during early Thursday. In doing so, the bright metal reverses from the 200-DMA amid the bearish MACD signals.
While a pullback from the key moving average and downbeat oscillator hints keep the XAG/USD sellers hopeful, the nearly oversold RSI (14) conditions suggest the quote has limited downside room.
As a result, an ascending support line from early September 2022, around $20.45, becomes crucial to watch for the Silver traders.
It should be noted that the lows marked during early November 2022, as well as on Wednesday, highlight $20.40 as an extra filter towards the south. Additionally, the $20.00 could act as the last defense of the XAG/USD buyers.
Hence, the Silver price is likely to extend the latest downturn but the room towards the south appears limited.
That said, the metal’s recovery moves past the 200-DMA hurdle of $21.00 isn’t an open invitation to the Silver buyers as a downward-sloping resistance line from February 08, close to $21.70 at the latest, could challenge the quote’s further advances.
Above all, the XAG/USD remains on the bear’s radar unless crossing a three-month-old horizontal resistance area surrounding $22.55-60.
Trend: Limited downside expected
Technical Levels: Supports and Resistances
XAGUSD currently trading at 20.94 at the time of writing. Pair opened at 20.98 and is trading with a change of -0.19% % .
| Overview | Overview.1 | |
|---|---|---|
| 0 | Today last price | 20.94 |
| 1 | Today Daily Change | -0.04 |
| 2 | Today Daily Change % | -0.19% |
| 3 | Today daily open | 20.98 |
The pair remains strongly bearish on the daily time frame. It trades below the 20 SMA @ 21.76, 50 SMA 22.97, 100 SMA @ 22.07 and 200 SMA @ 20.99.
| Trends | Trends.1 | |
|---|---|---|
| 0 | Daily SMA20 | 21.76 |
| 1 | Daily SMA50 | 22.97 |
| 2 | Daily SMA100 | 22.07 |
| 3 | Daily SMA200 | 20.99 |
The previous day high was 21.18 while the previous day low was 20.84. The daily 38.2% Fib levels comes at 21.05, expected to provide resistance. Similarly, the daily 61.8% fib level is at 20.97, expected to provide resistance.
Note the levels of interest below:
- Pivot support is noted at 20.82, 20.65, 20.47
- Pivot resistance is noted at 21.16, 21.35, 21.51
| Levels | Levels.1 |
|---|---|
| Previous Daily High | 21.18 |
| Previous Daily Low | 20.84 |
| Previous Weekly High | 21.98 |
| Previous Weekly Low | 20.74 |
| Previous Monthly High | 24.64 |
| Previous Monthly Low | 20.42 |
| Daily Fibonacci 38.2% | 21.05 |
| Daily Fibonacci 61.8% | 20.97 |
| Daily Pivot Point S1 | 20.82 |
| Daily Pivot Point S2 | 20.65 |
| Daily Pivot Point S3 | 20.47 |
| Daily Pivot Point R1 | 21.16 |
| Daily Pivot Point R2 | 21.35 |
| Daily Pivot Point R3 | 21.51 |
[/s2If]
Join Our Telegram Group
")


