WTI crude oil remains sidelined near two-week high after rising in the last two days. (Pivot Orderbook analysis)
…
This is a premium post.
[s2If !current_user_can(access_s2member_level4)]Please register for PREMIUM VERSION HERE to read full post below containing analysis. In case of any error or you think you are not able to read the full post below, please email us at support#nehcap.com [lwa][/s2If] [s2If current_user_can(access_s2member_level4)]
- WTI crude oil remains sidelined near two-week high after rising in the last two days.
- China data, policymakers’ comments suggest more energy demand from the world’s biggest commodity user.
- Fears of inflation, geopolitical concerns propel yields and challenge risk profile, as well as the Oil price.
- Downbeat inventories, US SPR issues keep sellers hopeful.
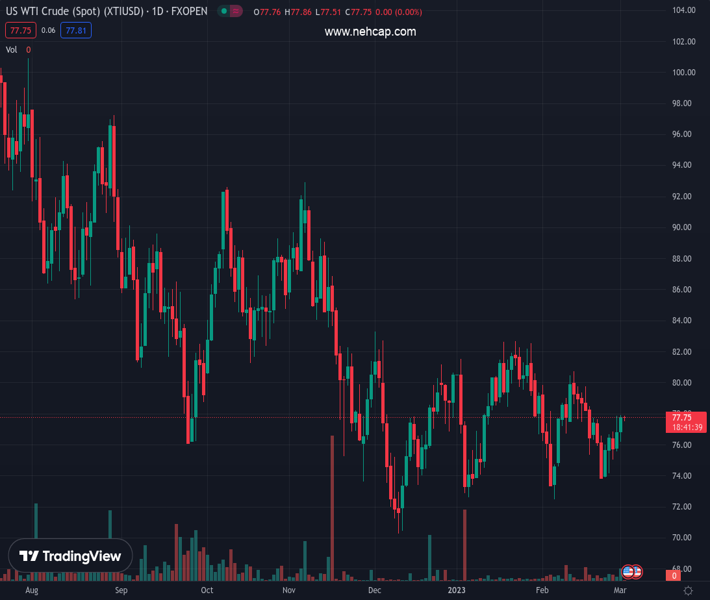
The pair currently trades last at 77.86.
The previous day high was 77.9 while the previous day low was 76.2. The daily 38.2% Fib levels comes at 77.25, expected to provide support. Similarly, the daily 61.8% fib level is at 76.85, expected to provide support.
WTI crude oil price grinds near $77.80-90 during early Thursday, following a two-day uptrend that poked the highest levels in a fortnight.
The black gold’s latest struggles could be linked to the mixed clues surrounding China, as well as the Oil stocks. However, sour sentiment and the US Dollar’s rebound appear the major upside hurdles for the quote.
That said, higher-than-expected US inventories also weigh on the energy benchmark as the Weekly data from the US Energy Information Administration (EIA) signals a 1.165M build in the Oil stocks versus 0.457M expected and 7.648M prior.
Elsewhere, US President Joe Biden’s readiness to keep pumping the markets with the Strategic Petroleum Reserve (SPR), as well as the lack of bids for Russian Oil, also exert downside pressure on the WTI crude oil price.
On the same line are the latest headlines from the New York Times (NYT) which suggest a possible rift between the US and China at the key event. “China is urging the start of peace talks, and some Group of 20 nations could support that idea when they gather in India, but U.S. officials argue Russia would not negotiate in good faith,” said the news.
It should be noted, however, that the recent pick-up in China activity data and upbeat comments from the policymakers of the dragon nation keeps the black gold buyers hopeful. Recently, China’s Human Resource Minister said, “China’s employment will continue to improve this year, and remains stable overall.” On Wednesday, China Finance Minister Liu He showed readiness to bolster the nation’s fiscal spending while also mentioning that the foundation of China’s economic recovery is still not stable.
That said, hawkish comments from the policymakers of the US Federal Reserve (Fed), the Bank of England (BoE) and the European Central Bank (ECB) also highlighted the need for further rate lifts to battle the inflation woes, which in turn exert downside pressure on the Oil price.
Amid these plays, the US 10-year Treasury bond yields rose to the highest levels since early November 2022 by piercing the 4.0% mark whereas the two-year counterpart rallied to the highest levels since June 2007 by flashing the 4.91% mark at the latest. The jump in the US Treasury bond yields portrays the market’s fears, which in turn probed bulls on Wall Street and weigh on S&P 500 Futures, as well as WTI bulls, as of late. As a result, the S&P 500 Futures dropped half a percent by the press time despite the mixed closing of the Wall Street benchmarks.
Moving on, updates from the G20 could join central bankers’ comments and the second-tier data from the US to entertain the Oil traders.
WTI crude oil buyers need to cross a five-week-old resistance line, around $78.70 by the press time, to push back bears.
Technical Levels: Supports and Resistances
XTIUSD currently trading at 77.86 at the time of writing. Pair opened at 77.82 and is trading with a change of 0.05% % .
| Overview | Overview.1 | |
|---|---|---|
| 0 | Today last price | 77.86 |
| 1 | Today Daily Change | 0.04 |
| 2 | Today Daily Change % | 0.05% |
| 3 | Today daily open | 77.82 |
The pair is trading above its 20 Daily moving average @ 77.04, below its 50 Daily moving average @ 78.02 , below its 100 Daily moving average @ 79.92 and below its 200 Daily moving average @ 88.1
| Trends | Trends.1 | |
|---|---|---|
| 0 | Daily SMA20 | 77.04 |
| 1 | Daily SMA50 | 78.02 |
| 2 | Daily SMA100 | 79.92 |
| 3 | Daily SMA200 | 88.10 |
The previous day high was 77.9 while the previous day low was 76.2. The daily 38.2% Fib levels comes at 77.25, expected to provide support. Similarly, the daily 61.8% fib level is at 76.85, expected to provide support.
Note the levels of interest below:
- Pivot support is noted at 76.71, 75.61, 75.01
- Pivot resistance is noted at 78.41, 79.0, 80.11
| Levels | Levels.1 |
|---|---|
| Previous Daily High | 77.90 |
| Previous Daily Low | 76.20 |
| Previous Weekly High | 77.75 |
| Previous Weekly Low | 73.86 |
| Previous Monthly High | 80.75 |
| Previous Monthly Low | 72.50 |
| Daily Fibonacci 38.2% | 77.25 |
| Daily Fibonacci 61.8% | 76.85 |
| Daily Pivot Point S1 | 76.71 |
| Daily Pivot Point S2 | 75.61 |
| Daily Pivot Point S3 | 75.01 |
| Daily Pivot Point R1 | 78.41 |
| Daily Pivot Point R2 | 79.00 |
| Daily Pivot Point R3 | 80.11 |
[/s2If]
Join Our Telegram Group
")


