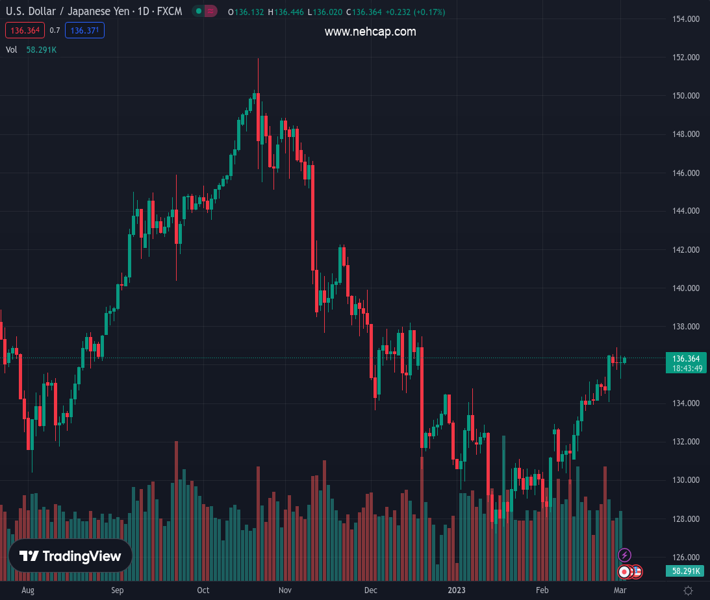
#USDJPY @ 136.371 grinds near intraday top after lackluster moves in the last two days., @nehcap view: Limited upside expected (Pivot Orderbook analysis)
…
This is a premium post.
[s2If !current_user_can(access_s2member_level4)]Please register for PREMIUM VERSION HERE to read full post below containing analysis. In case of any error or you think you are not able to read the full post below, please email us at support#nehcap.com [lwa][/s2If] [s2If current_user_can(access_s2member_level4)]
- USD/JPY grinds near intraday top after lackluster moves in the last two days.
- Sustained trading beyond key SMA, short-term important horizontal support keeps buyers hopeful.
- One-month-old ascending resistance line can challenge the latest run-up.
The pair currently trades last at 136.371.
The previous day high was 136.47 while the previous day low was 135.26. The daily 38.2% Fib levels comes at 136.01, expected to provide support. Similarly, the daily 61.8% fib level is at 135.72, expected to provide support.
USD/JPY struggles to overcome the previous two-day inaction as bulls keep the reins around 136.30 during early Thursday. In doing so, the Yen pair prints mild gains after bouncing off the 50-bar Simple Moving Average (SMA) and a two-week-old horizontal support zone.
Not only a sustained recovery from the key technical levels but the easing bearish bias of the MACD signals also favor the USD/JPY pair buyers.
With this, the risk-barometer pair is well-set to poke an upward-sloping resistance line from early February, close to 137.30 by the press time,
It’s worth noting that the weekly top surrounding 136.90 and the 137.00 round figure could act as immediate resistances for the USD/JPY bulls to watch.
In a case where USD/JPY remains firmer past 137.30, the late 2022 peak surrounding 138.20 should return to the charts.
On the flip side, the 50-SMA level of near 135.40 acts as an adjacent support for the Yen pair. Following that, the aforementioned two-week-long horizontal support zone puts a floor under the USD/JPY price of around 135.05-25.
It should be noted that the 100-SMA level of 134.00 and the February 20 swing low of around 133.95 could act as the last defense of the USD/JPY buyers.
To sum up, USD/JPY is likely to remain firmer and can once again poke the key resistance line stretched from February.
Trend: Limited upside expected
Technical Levels: Supports and Resistances
USDJPY currently trading at 136.38 at the time of writing. Pair opened at 136.18 and is trading with a change of 0.15% % .
| Overview | Overview.1 | |
|---|---|---|
| 0 | Today last price | 136.38 |
| 1 | Today Daily Change | 0.20 |
| 2 | Today Daily Change % | 0.15% |
| 3 | Today daily open | 136.18 |
The pair is trading above its 20 Daily moving average @ 133.47, above its 50 Daily moving average @ 131.94 , below its 100 Daily moving average @ 136.86 and below its 200 Daily moving average @ 137.22
| Trends | Trends.1 | |
|---|---|---|
| 0 | Daily SMA20 | 133.47 |
| 1 | Daily SMA50 | 131.94 |
| 2 | Daily SMA100 | 136.86 |
| 3 | Daily SMA200 | 137.22 |
The previous day high was 136.47 while the previous day low was 135.26. The daily 38.2% Fib levels comes at 136.01, expected to provide support. Similarly, the daily 61.8% fib level is at 135.72, expected to provide support.
Note the levels of interest below:
- Pivot support is noted at 135.47, 134.76, 134.26
- Pivot resistance is noted at 136.68, 137.18, 137.89
| Levels | Levels.1 |
|---|---|
| Previous Daily High | 136.47 |
| Previous Daily Low | 135.26 |
| Previous Weekly High | 136.52 |
| Previous Weekly Low | 133.92 |
| Previous Monthly High | 136.92 |
| Previous Monthly Low | 128.08 |
| Daily Fibonacci 38.2% | 136.01 |
| Daily Fibonacci 61.8% | 135.72 |
| Daily Pivot Point S1 | 135.47 |
| Daily Pivot Point S2 | 134.76 |
| Daily Pivot Point S3 | 134.26 |
| Daily Pivot Point R1 | 136.68 |
| Daily Pivot Point R2 | 137.18 |
| Daily Pivot Point R3 | 137.89 |
[/s2If]
Join Our Telegram Group
")


