#USDCHF @ 0.94267 advances due to higher US Treasury bond yields and a strong US Dollar. (Pivot Orderbook analysis)
…
This is a premium post.
[s2If !current_user_can(access_s2member_level4)]Please register for PREMIUM VERSION HERE to read full post below containing analysis. In case of any error or you think you are not able to read the full post below, please email us at support#nehcap.com [lwa][/s2If] [s2If current_user_can(access_s2member_level4)]
- USD/CHF advances due to higher US Treasury bond yields and a strong US Dollar.
- Bulls are eyeing a test of the 200-day EMA around 0.9452.
- USD/CHF Price Analysis: Neutral upwards and will be cemented by a daily close above 0.9400.
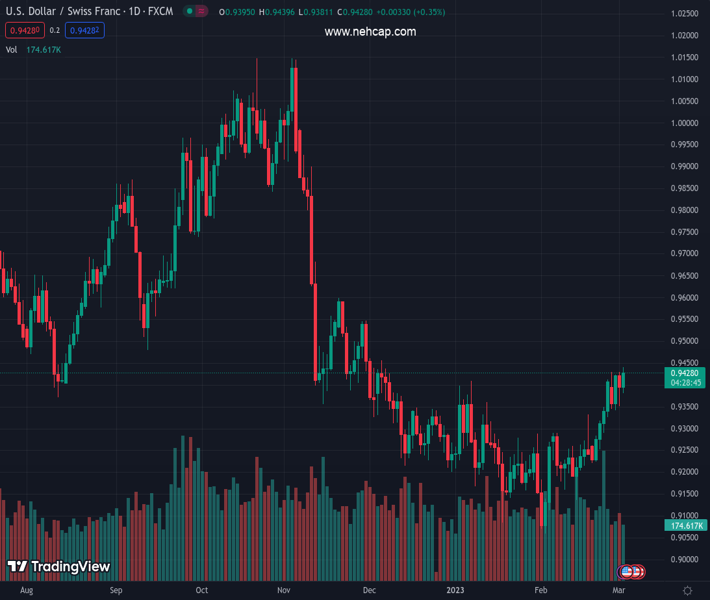
The pair currently trades last at 0.94267.
The previous day high was 0.9428 while the previous day low was 0.935. The daily 38.2% Fib levels comes at 0.938, expected to provide support. Similarly, the daily 61.8% fib level is at 0.9399, expected to provide support.
The USD/CHF staged ar recovery and reached a new year-to-date high at 0.9439 in the mid-North American session. A solid US jobs report triggered a US bond sell-off; consequently, UST bond yields are skyrocketing and are boosting the US Dollar (USD). The USD/CHF is trading at 0.9428, eyeing a break of a range above the February 27 daily high at 0.9429.
Technically speaking, the USD/CHF is neutral biased, though the break of the psychological 0.9400 could open the door for further gains. Above the current exchange rate sits the 200-day Exponential Moving Average (EMA) at 0.9452, seen as a reference to the bullish/bearishness of an asset. If the USD/CHF breaks the latter, the bias will shift to neutral-upwards. Unless the USD/CHF cracks the next resistance area at 0.9547, the November 30 high, the neutral-upwards tendency would be weak. Once the USD/CHAF pair snaps 0.9547, the major could rally toward the November 21 high at 0.9598.
Readings in oscillators support the bias change, with the Relative Strength Index (RSI) aiming higher and the Rate of Change (RoC). Therefore, the USD/CHF bias is neutral-upward.
On the other hand, failure to hold to gains above 0.9400 would exacerbate the USD/CHF fall to the 100-day EMA at 0.9386 before testing the January 24 high turned support at 0.9360.
Technical Levels: Supports and Resistances
USDCHF currently trading at 0.9424 at the time of writing. Pair opened at 0.9398 and is trading with a change of 0.28 % .
| Overview | Overview.1 | |
|---|---|---|
| 0 | Today last price | 0.9424 |
| 1 | Today Daily Change | 0.0026 |
| 2 | Today Daily Change % | 0.2800 |
| 3 | Today daily open | 0.9398 |
The pair is trading above its 20 Daily moving average @ 0.9273, above its 50 Daily moving average @ 0.9258 , below its 100 Daily moving average @ 0.9447 and below its 200 Daily moving average @ 0.9569
| Trends | Trends.1 | |
|---|---|---|
| 0 | Daily SMA20 | 0.9273 |
| 1 | Daily SMA50 | 0.9258 |
| 2 | Daily SMA100 | 0.9447 |
| 3 | Daily SMA200 | 0.9569 |
The previous day high was 0.9428 while the previous day low was 0.935. The daily 38.2% Fib levels comes at 0.938, expected to provide support. Similarly, the daily 61.8% fib level is at 0.9399, expected to provide support.
Note the levels of interest below:
- Pivot support is noted at 0.9356, 0.9314, 0.9278
- Pivot resistance is noted at 0.9434, 0.947, 0.9512
| Levels | Levels.1 |
|---|---|
| Previous Daily High | 0.9428 |
| Previous Daily Low | 0.9350 |
| Previous Weekly High | 0.9409 |
| Previous Weekly Low | 0.9221 |
| Previous Monthly High | 0.9429 |
| Previous Monthly Low | 0.9059 |
| Daily Fibonacci 38.2% | 0.9380 |
| Daily Fibonacci 61.8% | 0.9399 |
| Daily Pivot Point S1 | 0.9356 |
| Daily Pivot Point S2 | 0.9314 |
| Daily Pivot Point S3 | 0.9278 |
| Daily Pivot Point R1 | 0.9434 |
| Daily Pivot Point R2 | 0.9470 |
| Daily Pivot Point R3 | 0.9512 |
[/s2If]
Join Our Telegram Group
")


