#USDCHF @ 0.94129 picks up bids to reverse the previous day’s losses., @nehcap view: Further upside expected (Pivot Orderbook analysis)
…
This is a premium post.
[s2If !current_user_can(access_s2member_level4)]Please register for PREMIUM VERSION HERE to read full post below containing analysis. In case of any error or you think you are not able to read the full post below, please email us at support#nehcap.com [lwa][/s2If] [s2If current_user_can(access_s2member_level4)]
- USD/CHF picks up bids to reverse the previous day’s losses.
- Sustained trading above the key Fibonacci retracement, upbeat oscillators join bullish chart pattern to favor buyers.
- Sellers have a bumpy road to face on their return, 0.9345 appears short-term key support.
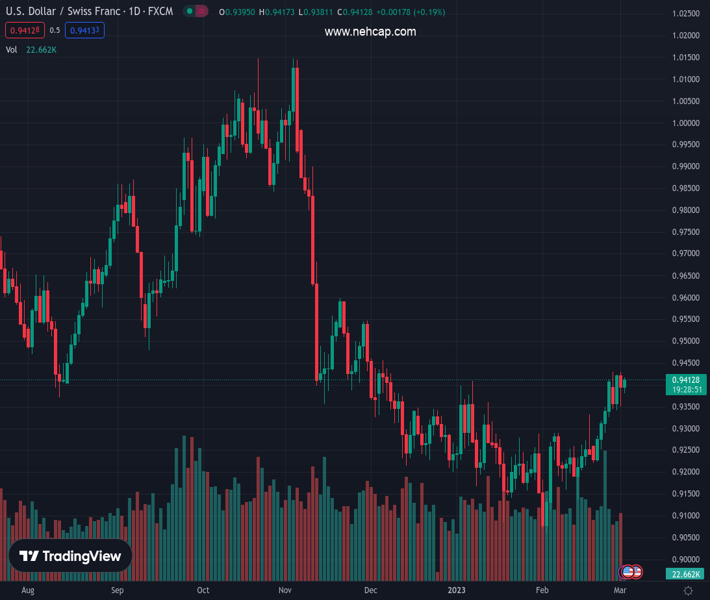
The pair currently trades last at 0.94129.
The previous day high was 0.9428 while the previous day low was 0.935. The daily 38.2% Fib levels comes at 0.938, expected to provide support. Similarly, the daily 61.8% fib level is at 0.9399, expected to provide support.
USD/CHF renews its intraday high around 0.9415 as bulls return to the table, after the previous day’s absence, during early Thursday. In doing so, the Swiss currency pair remains firmer past the 61.8% Fibonacci retracement level of its downturn from late November 2022 to early February 2023.
Not only the successful trading beyond the 61.8% Fibonacci retracement, also known as the golden Fibonacci ratio, but the bullish MACD signals and upbeat RSI (14), not overbought, also keeps the USD/CHF buyers hopeful of witnessing further advances.
However, the 100-DMA hurdle surrounding 0.9445 guards the pair’s immediate upside.
Following that, the stated channel’s top line and late November swing high could act as the last defenses of the USD/CHF bears around 0.9480 and 0.9550 respectively.
It’s worth observing that the November 21 high of around 0.9600 appears the key for the USD/CHF bulls to track afterward.
Meanwhile, pullback remains elusive till the quote stays inside the aforementioned bullish channel, established on February 10, currently between 0.9480 and 0.9345.
That said, the 61.8% Fibonacci retracement level of 0.9393 can act as immediate support.
Overall, USD/CHF is likely to remain firmer and can cross the 100-DMA immediate hurdle while its upside past 0.9480 appears doubtful.
Trend: Further upside expected
Technical Levels: Supports and Resistances
USDCHF currently trading at 0.9416 at the time of writing. Pair opened at 0.9398 and is trading with a change of 0.19% % .
| Overview | Overview.1 | |
|---|---|---|
| 0 | Today last price | 0.9416 |
| 1 | Today Daily Change | 0.0018 |
| 2 | Today Daily Change % | 0.19% |
| 3 | Today daily open | 0.9398 |
The pair is trading above its 20 Daily moving average @ 0.9273, above its 50 Daily moving average @ 0.9258 , below its 100 Daily moving average @ 0.9447 and below its 200 Daily moving average @ 0.9569
| Trends | Trends.1 | |
|---|---|---|
| 0 | Daily SMA20 | 0.9273 |
| 1 | Daily SMA50 | 0.9258 |
| 2 | Daily SMA100 | 0.9447 |
| 3 | Daily SMA200 | 0.9569 |
The previous day high was 0.9428 while the previous day low was 0.935. The daily 38.2% Fib levels comes at 0.938, expected to provide support. Similarly, the daily 61.8% fib level is at 0.9399, expected to provide support.
Note the levels of interest below:
- Pivot support is noted at 0.9356, 0.9314, 0.9278
- Pivot resistance is noted at 0.9434, 0.947, 0.9512
| Levels | Levels.1 |
|---|---|
| Previous Daily High | 0.9428 |
| Previous Daily Low | 0.9350 |
| Previous Weekly High | 0.9409 |
| Previous Weekly Low | 0.9221 |
| Previous Monthly High | 0.9429 |
| Previous Monthly Low | 0.9059 |
| Daily Fibonacci 38.2% | 0.9380 |
| Daily Fibonacci 61.8% | 0.9399 |
| Daily Pivot Point S1 | 0.9356 |
| Daily Pivot Point S2 | 0.9314 |
| Daily Pivot Point S3 | 0.9278 |
| Daily Pivot Point R1 | 0.9434 |
| Daily Pivot Point R2 | 0.9470 |
| Daily Pivot Point R3 | 0.9512 |
[/s2If]
Join Our Telegram Group
")


