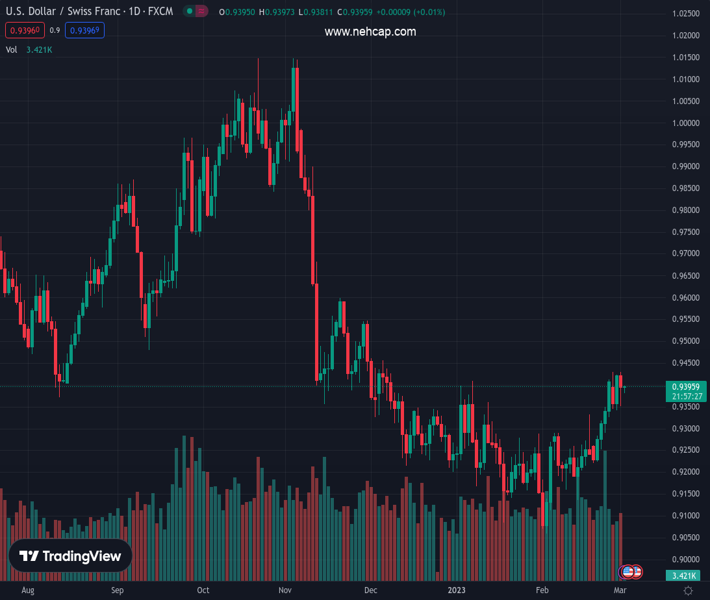
#USDCHF @ 0.93949 picks up bids to reverse the previous day’s pullback moves. (Pivot Orderbook analysis)
…
This is a premium post.
[s2If !current_user_can(access_s2member_level4)]Please register for PREMIUM VERSION HERE to read full post below containing analysis. In case of any error or you think you are not able to read the full post below, please email us at support#nehcap.com [lwa][/s2If] [s2If current_user_can(access_s2member_level4)]
- USD/CHF picks up bids to reverse the previous day’s pullback moves.
- Swiss PMI, Real Retail Sales also came in softer after downbeat Q4 GDP.
- US ISM PMI details, hawkish Fed talks keep inflation fears on the table and propel the US Treasury bond yields.
- Second-tier data, risk catalysts are the key to clear directions.
The pair currently trades last at 0.93949.
The previous day high was 0.942 while the previous day low was 0.9342. The daily 38.2% Fib levels comes at 0.939, expected to provide support. Similarly, the daily 61.8% fib level is at 0.9371, expected to provide support.
USD/CHF licks its wounds around 0.9400, following a downbeat start of the March month, as the Swiss currency pair picks up bids during early Thursday. In doing so, the quote justifies downbeat statistics at home, versus firmer details of the US data, as well as the strong Treasury bond yields and hawkish Fed talks, which could recall the US Dollar bulls.
That said, Swiss Real Retail Sales shrank 2.2% YoY in January versus 2.2% expected growth a revised down previous reading of -3.0%. On the same line was the Swiss SVME Purchasing Managers’ Index for February as it marched 48.9 market forecasts versus 49.3 prior. It should be noted that the Swiss Gross Domestic Product (GDP) arrived at 0% in the fourth quarter (Q4) of 2022 vs. an expected growth of 0.3% and 0.2% recorded in the third quarter.
On the other hand, US ISM Manufacturing PMI details renew inflation fears as the headline gauge rose to 47.7 from 47.4 prior, versus the 48.0 expected but the Prices Paid and New Orders marked the highest figures in five and four months respectively.
Not only the data but hawkish Federal Reserve (Fed) talks also challenge the previous day’s US Dollar weakness, as well as the USD/CHF pullback. Minneapolis Federal Reserve (Fed) President Neel Kashkari said, “Wage growth is now too high to be consistent with 2% inflation.” The policymaker also added and noted that it is concerning that the Federal Reserve’s rate hikes so far have not brought down service inflation.
It’s worth noting, however, that the previously softer US data dump and China-inspired risk-on mood, as well as month-start consolidation, seemed to have teased the USD/CHF bears.
Amid these plays, the US 10-year Treasury bond yields rose to the highest levels since early November 2022 by poking the 4.0% mark whereas the two-year counterpart rallied to the June 2007 levels by piercing the 4.90% mark. The jump in the US Treasury bond yields suggests the market’s fears of inflation and recession, which in turn probed bulls on Wall Street and weigh on S&P 500 Futures of late, suggesting a likely rebound on the US Dollar.
Looking ahead, a light calendar pushes the USD/CHF traders to keep track of the risk catalysts for fresh impulse.
A 13-day-old bullish channel, currently between 0.9345 and 0.9480, keeps USD/CHF buyers hopeful.
Technical Levels: Supports and Resistances
USDCHF currently trading at 0.9395 at the time of writing. Pair opened at 0.9418 and is trading with a change of -0.24% % .
| Overview | Overview.1 | |
|---|---|---|
| 0 | Today last price | 0.9395 |
| 1 | Today Daily Change | -0.0023 |
| 2 | Today Daily Change % | -0.24% |
| 3 | Today daily open | 0.9418 |
The pair is trading above its 20 Daily moving average @ 0.9257, above its 50 Daily moving average @ 0.9255 , below its 100 Daily moving average @ 0.9453 and below its 200 Daily moving average @ 0.957
| Trends | Trends.1 | |
|---|---|---|
| 0 | Daily SMA20 | 0.9257 |
| 1 | Daily SMA50 | 0.9255 |
| 2 | Daily SMA100 | 0.9453 |
| 3 | Daily SMA200 | 0.9570 |
The previous day high was 0.942 while the previous day low was 0.9342. The daily 38.2% Fib levels comes at 0.939, expected to provide support. Similarly, the daily 61.8% fib level is at 0.9371, expected to provide support.
Note the levels of interest below:
- Pivot support is noted at 0.9366, 0.9315, 0.9288
- Pivot resistance is noted at 0.9445, 0.9471, 0.9523
| Levels | Levels.1 |
|---|---|
| Previous Daily High | 0.9420 |
| Previous Daily Low | 0.9342 |
| Previous Weekly High | 0.9409 |
| Previous Weekly Low | 0.9221 |
| Previous Monthly High | 0.9429 |
| Previous Monthly Low | 0.9059 |
| Daily Fibonacci 38.2% | 0.9390 |
| Daily Fibonacci 61.8% | 0.9371 |
| Daily Pivot Point S1 | 0.9366 |
| Daily Pivot Point S2 | 0.9315 |
| Daily Pivot Point S3 | 0.9288 |
| Daily Pivot Point R1 | 0.9445 |
| Daily Pivot Point R2 | 0.9471 |
| Daily Pivot Point R3 | 0.9523 |
[/s2If]
Join Our Telegram Group
")


