#USDCAD @ 1.36168 clings to mild gains after defying a bullish chart formation., @nehcap view: Limited upside expected (Pivot Orderbook analysis)
…
This is a premium post.
[s2If !current_user_can(access_s2member_level4)]Please register for PREMIUM VERSION HERE to read full post below containing analysis. In case of any error or you think you are not able to read the full post below, please email us at support#nehcap.com [lwa][/s2If] [s2If current_user_can(access_s2member_level4)]
- USD/CAD clings to mild gains after defying a bullish chart formation.
- Upbeat oscillators, sustained trading beyond previous resistance line keep buyers hopeful.
- 100-DMA appears the key support, Loonie buyers have multiple hurdles on the north.
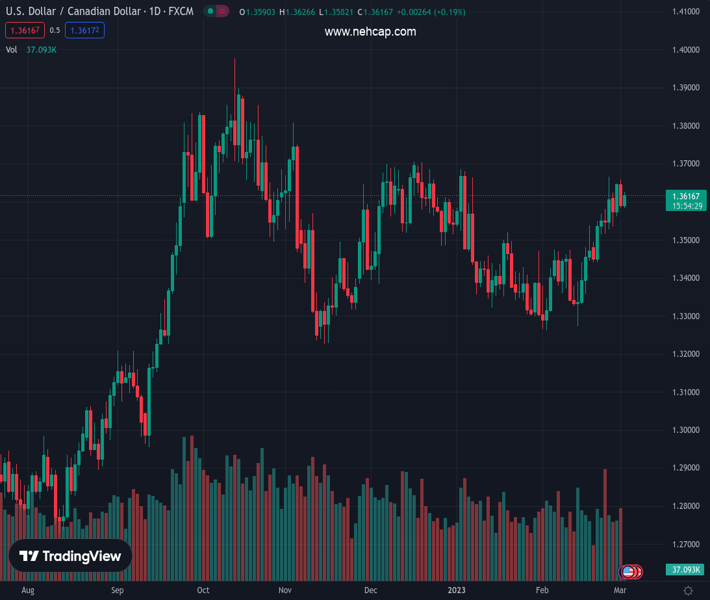
The pair currently trades last at 1.36168.
The previous day high was 1.3659 while the previous day low was 1.3584. The daily 38.2% Fib levels comes at 1.3613, expected to provide support. Similarly, the daily 61.8% fib level is at 1.3631, expected to provide resistance.
USD/CAD bulls struggle to keep the reins around the 1.3600 threshold during early Thursday in Europe.
The Loonie pair’s latest grinds could be linked to the mixed technical signals witnessed on the Daily chart, as well as the market’s inaction.
That said, the USD/CAD pair slipped beneath a two-week-old bullish channel’s lower line the previous day, which in turn suggested the quote’s declines towards the resistance-turned-support from mid-December 2022, close to 1.3550 by the press time.
However, the 100-DMA level surrounding the 1.3500 threshold and multiple tops marked during late January, as well as early February, near 1.3470, could challenge the USD/CAD bears past 1.3550.
Alternatively, the bullish MACD signals and upbeat RSI (14), not oversold, keeps USD/CAD buyers hopeful of bouncing back beyond the previous support line of the stated channel, near 1.3620.
Following that, the tops marked in February and January, respectively around 1.3665 and 1.3685 will precede the December 16, 2022 swing high of 1.3705 to challenge the USD/CAD buyers.
To sum up, USD/CAD is likely to remain sidelined between the previous support line surrounding 1.3550 and the immediate channel’s lower line of near 1.3620.
Trend: Limited upside expected
Technical Levels: Supports and Resistances
USDCAD currently trading at 1.361 at the time of writing. Pair opened at 1.3597 and is trading with a change of 0.10% % .
| Overview | Overview.1 | |
|---|---|---|
| 0 | Today last price | 1.361 |
| 1 | Today Daily Change | 0.0013 |
| 2 | Today Daily Change % | 0.10% |
| 3 | Today daily open | 1.3597 |
The pair remains strongly bullish on the daily timeframe. It trades above its 20 SMA @ 1.3466, 50 SMA 1.346, 100 SMA @ 1.3506 and 200 SMA @ 1.3276.
| Trends | Trends.1 | |
|---|---|---|
| 0 | Daily SMA20 | 1.3466 |
| 1 | Daily SMA50 | 1.3460 |
| 2 | Daily SMA100 | 1.3506 |
| 3 | Daily SMA200 | 1.3276 |
The previous day high was 1.3659 while the previous day low was 1.3584. The daily 38.2% Fib levels comes at 1.3613, expected to provide support. Similarly, the daily 61.8% fib level is at 1.3631, expected to provide resistance.
Note the levels of interest below:
- Pivot support is noted at 1.3568, 1.3539, 1.3493
- Pivot resistance is noted at 1.3643, 1.3688, 1.3717
| Levels | Levels.1 |
|---|---|
| Previous Daily High | 1.3659 |
| Previous Daily Low | 1.3584 |
| Previous Weekly High | 1.3666 |
| Previous Weekly Low | 1.3441 |
| Previous Monthly High | 1.3666 |
| Previous Monthly Low | 1.3262 |
| Daily Fibonacci 38.2% | 1.3613 |
| Daily Fibonacci 61.8% | 1.3631 |
| Daily Pivot Point S1 | 1.3568 |
| Daily Pivot Point S2 | 1.3539 |
| Daily Pivot Point S3 | 1.3493 |
| Daily Pivot Point R1 | 1.3643 |
| Daily Pivot Point R2 | 1.3688 |
| Daily Pivot Point R3 | 1.3717 |
[/s2If]
Join Our Telegram Group
")


