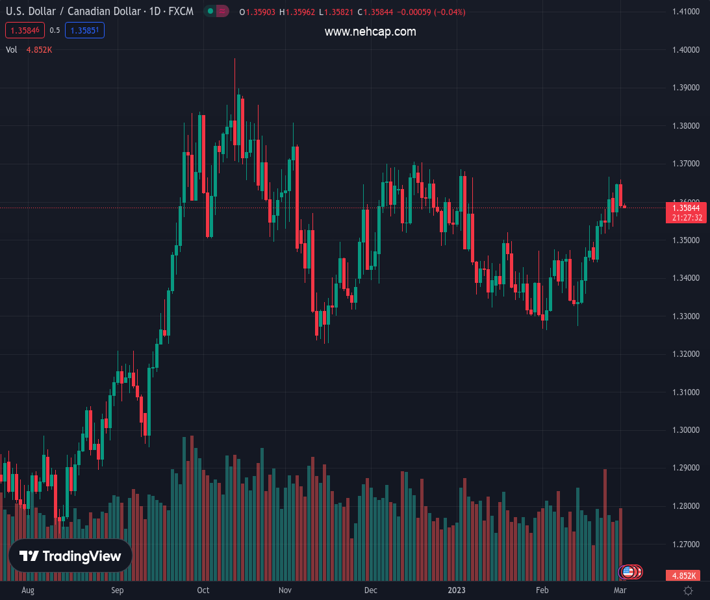
#USDCAD @ 1.35839 defends the previous day’s bearish bias amid sluggish session. (Pivot Orderbook analysis)
…
This is a premium post.
[s2If !current_user_can(access_s2member_level4)]Please register for PREMIUM VERSION HERE to read full post below containing analysis. In case of any error or you think you are not able to read the full post below, please email us at support#nehcap.com [lwa][/s2If] [s2If current_user_can(access_s2member_level4)]
- USD/CAD defends the previous day’s bearish bias amid sluggish session.
- US Dollar traces yields to probe bears after US data, Fed talks renew inflation woes.
- Oil price fades China-inspired optimism after higher-than-expected inventories.
The pair currently trades last at 1.35839.
The previous day high was 1.3659 while the previous day low was 1.3584. The daily 38.2% Fib levels comes at 1.3613, expected to provide resistance. Similarly, the daily 61.8% fib level is at 1.3631, expected to provide resistance.
USD/CAD holds lower grounds near 1.3600 following its biggest daily slump in three weeks as the Loonie pair traders struggle to analyze mixed catalysts during Thursday’s sluggish Asian session.
The quote’s heavy fall on Wednesday could be linked to the market’s upbeat sentiment, as well as welcome prints of Canada activity data. Adding strength to the downside bias was the firmer Oil price, Canada’s main export item.
Market sentiment improved after Tuesday‘s softer US data contrasted with Wednesday’s strong China PMIs for February. On the same line were comments from China Finance Minister Liu He as he showed readiness to bolster the nation’s fiscal spending while also mentioning that the foundation of China’s economic recovery is still not stable.
It’s worth noting that Oil price rose in the last two consecutive days to print the highest level since February 17, making rounds to $77.80 at the latest. In doing so, the black gold struggles to justify the previously upbeat sentiment as US Oil inventories grew more than expected, per the weekly data from the US Energy Information Administration (EIA).
Elsewhere, Canada’s S&P Global Manufacturing PMI for February improved to 52.4 versus 50.1 expected and 51.0 prior, which in turn challenged the USD/CAD buyers even as the US data renewed inflation fears. That said, the US ISM Manufacturing PMI details renew inflation fears as the headline gauge rose to 47.7 in February from 47.4 prior, versus the 48.0 expected. However, the PMI details suggest that the Prices Paid and New Orders marked the highest figures in five and four months respectively.
It should be observed, however, that the hawkish Fed bets and firmer US Treasury bond yields, coupled with the higher Oil inventories appear to challenge the USD/CAD bears afterward.
On Wednesday, Minneapolis Federal Reserve (Fed) President Neel Kashkari said, “Wage growth is now too high to be consistent with 2% inflation.” The policymaker also added and noted that it is concerning that the Federal Reserve’s rate hikes so far have not brought down service inflation.
Additionally, the US 10-year Treasury bond yields rose to the highest levels since early November 2022 by poking the 4.0% mark whereas the two-year counterpart rallied to the June 2007 levels by piercing the 4.90% mark. The jump in the US Treasury bond yields suggests the market’s fears of inflation and recession, which in turn probed bulls on Wall Street and weigh on S&P 500 Futures of late, signaling a rebound on the US Dollar.
Amid these plays, the USD/CAD bears kept the reins but are likely to struggle as a light calendar and a shift in sentiment looms.
A clear downside break of the two-week-old ascending support line, now resistance around 1.3630, directs USD/CAD towards a late January swing high near 1.350.
Technical Levels: Supports and Resistances
USDCAD currently trading at 1.359 at the time of writing. Pair opened at 1.3597 and is trading with a change of -0.05% % .
| Overview | Overview.1 | |
|---|---|---|
| 0 | Today last price | 1.359 |
| 1 | Today Daily Change | -0.0007 |
| 2 | Today Daily Change % | -0.05% |
| 3 | Today daily open | 1.3597 |
The pair remains strongly bullish on the daily timeframe. It trades above its 20 SMA @ 1.3466, 50 SMA 1.346, 100 SMA @ 1.3506 and 200 SMA @ 1.3276.
| Trends | Trends.1 | |
|---|---|---|
| 0 | Daily SMA20 | 1.3466 |
| 1 | Daily SMA50 | 1.3460 |
| 2 | Daily SMA100 | 1.3506 |
| 3 | Daily SMA200 | 1.3276 |
The previous day high was 1.3659 while the previous day low was 1.3584. The daily 38.2% Fib levels comes at 1.3613, expected to provide resistance. Similarly, the daily 61.8% fib level is at 1.3631, expected to provide resistance.
Note the levels of interest below:
- Pivot support is noted at 1.3568, 1.3539, 1.3493
- Pivot resistance is noted at 1.3643, 1.3688, 1.3717
| Levels | Levels.1 |
|---|---|
| Previous Daily High | 1.3659 |
| Previous Daily Low | 1.3584 |
| Previous Weekly High | 1.3666 |
| Previous Weekly Low | 1.3441 |
| Previous Monthly High | 1.3666 |
| Previous Monthly Low | 1.3262 |
| Daily Fibonacci 38.2% | 1.3613 |
| Daily Fibonacci 61.8% | 1.3631 |
| Daily Pivot Point S1 | 1.3568 |
| Daily Pivot Point S2 | 1.3539 |
| Daily Pivot Point S3 | 1.3493 |
| Daily Pivot Point R1 | 1.3643 |
| Daily Pivot Point R2 | 1.3688 |
| Daily Pivot Point R3 | 1.3717 |
[/s2If]
Join Our Telegram Group
")


