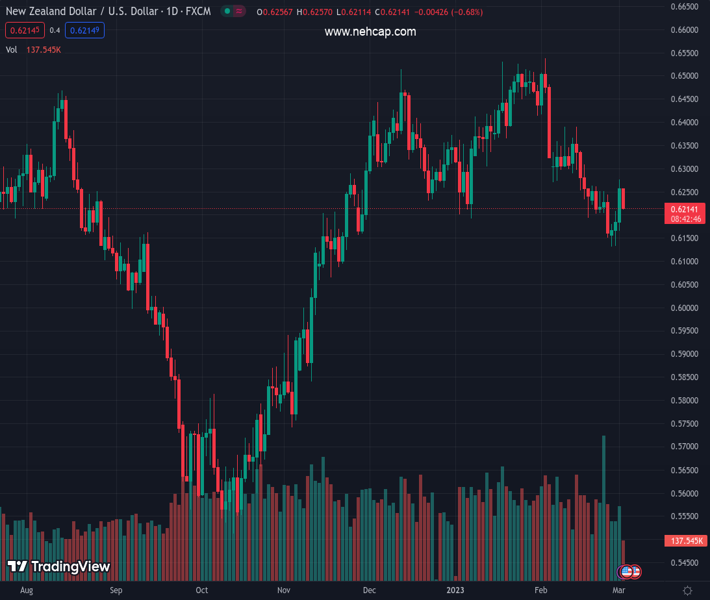
#NZDUSD @ 0.62154 meets with a fresh supply and snaps a three-day winning streak to a nearly two-week high. (Pivot Orderbook analysis)
…
This is a premium post.
[s2If !current_user_can(access_s2member_level4)]Please register for PREMIUM VERSION HERE to read full post below containing analysis. In case of any error or you think you are not able to read the full post below, please email us at support#nehcap.com [lwa][/s2If] [s2If current_user_can(access_s2member_level4)]
- NZD/USD meets with a fresh supply and snaps a three-day winning streak to a nearly two-week high.
- Hawkish Fed expectations continue to push the US bond yields higher and revive the USD demand.
- Looming recession risks further benefit the safe-haven buck and weigh on the risk-sensitive Kiwi.
The pair currently trades last at 0.62154.
The previous day high was 0.6277 while the previous day low was 0.6166. The daily 38.2% Fib levels comes at 0.6235, expected to provide resistance. Similarly, the daily 61.8% fib level is at 0.6208, expected to provide support.
The NZD/USD pair comes under some renewed selling pressure on Thursday and stalls this week’s goodish rebound from the 0.6130 area, or its lowest level since November 23. The pair maintains its offered tone around the 0.6220-0.6215 region heading into the North American session and for now, seems to have snapped a three-day winning streak to a nearly two-week top set on Wednesday.
The US Dollar makes a solid comeback and reverses a major part of the previous day’s sharp retracement slide from a multi-week high, which, in turn, is seen as a key factor weighing on the NZD/USD pair. The prospects for further policy tightening by the Federal Reserve remain supportive of the ongoing move up in the US Treasury bond yields. This, along with looming recession risks, provides an additional boost to the safe-haven Greenback.
The US CPI, PPI and the PCE Price Index data released recently indicated that inflation isn’t coming down quite as fast as hoped. Adding to this, the incoming upbeat US macro data pointed to an economy that remains resilient despite rising borrowing costs. This reaffirmed market expectations that the Fed will stick to its hawkish stance for longer. Moreover,
Minneapolis Fed President Neel Kashkari suggests that a 50 bps lift-off at the March was still a possibility.
This, in turn, pushes the yield on the benchmark 10-year US government bond back above the 4.0% threshold, or its highest level since November, and continues to underpin the buck. Investors, meanwhile, remain worried about economic headwinds stemming from rapidly rising borrowing costs. This overshadows the optimism led by the Chinese PMI prints on Wednesday and favours the USD bulls, supporting prospects for additional losses for the NZD/USD pair.
Next on tap is the release of the Weekly Initial Jobless Claims data from the US, which, along with the US bond yields, will influence the USD price dynamics. Apart from this, traders will further take cues from the broader risk sentiment to grab short-term opportunities around the NZD/USD pair. The focus will then shift to the Reserve Bank of New Zealand (RBNZ) Governor Adrian Orr’s scheduled speech during the Asian session on Friday.
Technical Levels: Supports and Resistances
NZDUSD currently trading at 0.6217 at the time of writing. Pair opened at 0.6253 and is trading with a change of -0.58 % .
| Overview | Overview.1 | |
|---|---|---|
| 0 | Today last price | 0.6217 |
| 1 | Today Daily Change | -0.0036 |
| 2 | Today Daily Change % | -0.5800 |
| 3 | Today daily open | 0.6253 |
The pair is trading below its 20 Daily moving average @ 0.6277, below its 50 Daily moving average @ 0.634 , above its 100 Daily moving average @ 0.6205 and above its 200 Daily moving average @ 0.618
| Trends | Trends.1 | |
|---|---|---|
| 0 | Daily SMA20 | 0.6277 |
| 1 | Daily SMA50 | 0.6340 |
| 2 | Daily SMA100 | 0.6205 |
| 3 | Daily SMA200 | 0.6180 |
The previous day high was 0.6277 while the previous day low was 0.6166. The daily 38.2% Fib levels comes at 0.6235, expected to provide resistance. Similarly, the daily 61.8% fib level is at 0.6208, expected to provide support.
Note the levels of interest below:
- Pivot support is noted at 0.6187, 0.6121, 0.6076
- Pivot resistance is noted at 0.6298, 0.6343, 0.6409
| Levels | Levels.1 |
|---|---|
| Previous Daily High | 0.6277 |
| Previous Daily Low | 0.6166 |
| Previous Weekly High | 0.6263 |
| Previous Weekly Low | 0.6151 |
| Previous Monthly High | 0.6538 |
| Previous Monthly Low | 0.6131 |
| Daily Fibonacci 38.2% | 0.6235 |
| Daily Fibonacci 61.8% | 0.6208 |
| Daily Pivot Point S1 | 0.6187 |
| Daily Pivot Point S2 | 0.6121 |
| Daily Pivot Point S3 | 0.6076 |
| Daily Pivot Point R1 | 0.6298 |
| Daily Pivot Point R2 | 0.6343 |
| Daily Pivot Point R3 | 0.6409 |
[/s2If]
Join Our Telegram Group
")


