Investors are showing caution for Asian stocks amid soaring US Yields. (Pivot Orderbook analysis)
…
This is a premium post.
[s2If !current_user_can(access_s2member_level4)]Please register for PREMIUM VERSION HERE to read full post below containing analysis. In case of any error or you think you are not able to read the full post below, please email us at support#nehcap.com [lwa][/s2If] [s2If current_user_can(access_s2member_level4)]
- Investors are showing caution for Asian stocks amid soaring US Yields.
- Chinese equities have failed to capitalize on upbeat Caixin Manufacturing PMI data.
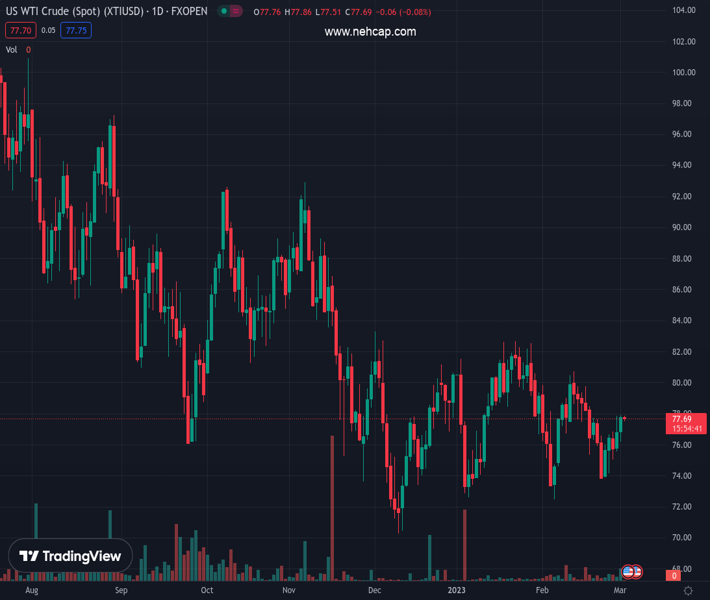
- Upbeat Caixin PMI and lower-than-expected US oil inventory report have infused fresh blood into the oil bulls.
The pair currently trades last at 27488.52.
The previous day high was 27577.45 while the previous day low was 27407.48. The daily 38.2% Fib levels comes at 27472.41, expected to provide support. Similarly, the daily 61.8% fib level is at 27512.52, expected to provide resistance.
Markets in the Asian domain have turned cautious as US Treasury yields are soaring like there is no tomorrow. The alpha offered on the 10-year US government bonds has refreshed its three-month high at 4.03%. The demand for US government bonds has dropped dramatically as investors are expecting the United States recession a reality as the Federal Reserve (Fed) looks set to push rates above 5% sooner. S&P500 futures have stretched their downside, portraying a negative market sentiment.
At the press time, Japan’s Nikkei225 remained flat, SZSE Component eased 0.26%, Hang Seng dropped 0.40%, and Nifty50 tumbled 0.56%.
Chinese equities have failed to capitalize on upbeat Caixin Manufacturing PMI data. The Chinese economy looks set on a path of economic recovery as the administration and the People’s Bank of China (PBoC) are pumping stimulus to spur the growth rate. Dismantling of the pandemic controls is allowing firms to operate at their full capacity.
Meanwhile, Bank of Japan (BoJ) policymakers are constantly chanting dovish stances on monetary policy guidance. After dovish commentaries from BoJ Governor Nominee Kazuo Ueda and BoJ Deputy Governor Ryozo Himino, the current monetary policy has also been considered as appropriate by board member Junko Nakagawa. He cited “An expansionary policy is highly essential for supporting the economy and fueling wages.”
On the oil front, oil prices are looking to extend their recovery to $78.00 in hopes of recovery in China post the release of the Caixin Manufacturing PMI, which overshadowed the risk of a global recession. Also, the less-than-anticipated build-up of oil inventories reported by the United States Energy Information Administration (EIA) has infused fresh blood into oil bulls. The US EIA reported a build-up of oil stockpiles by 1.165 million barrels for the week ending February 24.
Technical Levels: Supports and Resistances
XTIUSD currently trading at 27488.52 at the time of writing. Pair opened at 27488.52 and is trading with a change of 0.0 % .
| Overview | Overview.1 | |
|---|---|---|
| 0 | Today last price | 27488.52 |
| 1 | Today Daily Change | 0.00 |
| 2 | Today Daily Change % | 0.00 |
| 3 | Today daily open | 27488.52 |
The pair is trading below its 20 Daily moving average @ 27531.93, above its 50 Daily moving average @ 26921.63 , above its 100 Daily moving average @ 27276.82 and above its 200 Daily moving average @ 27318.25
| Trends | Trends.1 | |
|---|---|---|
| 0 | Daily SMA20 | 27531.93 |
| 1 | Daily SMA50 | 26921.63 |
| 2 | Daily SMA100 | 27276.82 |
| 3 | Daily SMA200 | 27318.25 |
The previous day high was 27577.45 while the previous day low was 27407.48. The daily 38.2% Fib levels comes at 27472.41, expected to provide support. Similarly, the daily 61.8% fib level is at 27512.52, expected to provide resistance.
Note the levels of interest below:
- Pivot support is noted at 27404.85, 27321.18, 27234.88
- Pivot resistance is noted at 27574.82, 27661.12, 27744.79
| Levels | Levels.1 |
|---|---|
| Previous Daily High | 27577.45 |
| Previous Daily Low | 27407.48 |
| Previous Weekly High | 27556.86 |
| Previous Weekly Low | 26985.47 |
| Previous Monthly High | 27812.68 |
| Previous Monthly Low | 26985.47 |
| Daily Fibonacci 38.2% | 27472.41 |
| Daily Fibonacci 61.8% | 27512.52 |
| Daily Pivot Point S1 | 27404.85 |
| Daily Pivot Point S2 | 27321.18 |
| Daily Pivot Point S3 | 27234.88 |
| Daily Pivot Point R1 | 27574.82 |
| Daily Pivot Point R2 | 27661.12 |
| Daily Pivot Point R3 | 27744.79 |
[/s2If]
Join Our Telegram Group
")


