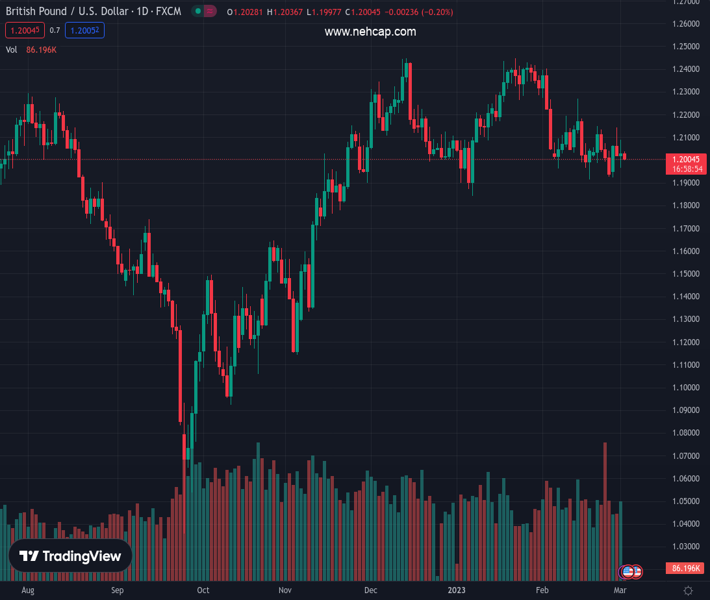
#GBPUSD @ 1.20046 extends pullback from one-month-old descending resistance line to print three-day downtrend. (Pivot Orderbook analysis)
…
This is a premium post.
[s2If !current_user_can(access_s2member_level4)]Please register for PREMIUM VERSION HERE to read full post below containing analysis. In case of any error or you think you are not able to read the full post below, please email us at support#nehcap.com [lwa][/s2If] [s2If current_user_can(access_s2member_level4)]
- GBP/USD extends pullback from one-month-old descending resistance line to print three-day downtrend.
- DUP dislikes mismatch between Brexit deal and UK PM Sunak’s promises, British businesses fear economic slowdown due to the terms.
- BoE’s Bailey appeared neutral and probed Cable buyers.
- Upbeat details of US ISM PMI, Fed talks underpin yields and the US Dollar amid sluggish day.
The pair currently trades last at 1.20046.
The previous day high was 1.209 while the previous day low was 1.1965. The daily 38.2% Fib levels comes at 1.2013, expected to provide resistance. Similarly, the daily 61.8% fib level is at 1.2042, expected to provide resistance.
GBP/USD bears attack the 1.2000 psychological magnet during a three-day downtrend amid fresh challenges for the Brexit deal and a rally in the US Treasury bond yields. However, the market’s lack of action heading into Thursday’s London open appears to restrict the Cable pair’s immediate downside.
That said, The Telegraph came out with the downbeat updates surrounding the Brexit deal while citing the Democratic Unionist Party’s (DUP) dissatisfaction with the parts of the previously hailed EU-UK departure terms over the Northern Ireland Protocol (NIP). “Sammy Wilson, the Unionist party’s Brexit spokesman in the Commons, suggested that parts of the Windsor Framework do not tally with what the Prime Minister has said in public,” said the news.
Elsewhere, the Financial Times (FT) came out with a survey saying that about two-thirds of UK businesses believe that government plans to disentangle British and EU law will cause more uncertainty and will not increase economic growth, according to a poll conducted on behalf of an alliance of environmental and public safety organizations.
It should be noted that the neutral comments from Bank of England (BoE) Governor Andrew Bailey, versus the hawkish remarks from Minneapolis Federal Reserve (Fed) President Neel Kashkari, also weigh on the GBP/USD prices. On the same line are the downbeat prints of the UK S&P/CIPS Manufacturing PMI versus the upbeat details of the US ISM Manufacturing PMI.
On a different page, consistent inflation woes and fading optimism over China’s economic growth, recently joined by the fears of the Sino-American tussles, also exert downside pressure on the GBP/USD prices. Amid these plays, the US 10-year Treasury bond yields rose to the highest levels since early November 2022 by piercing the 4.0% mark whereas the two-year counterpart rallied to the highest levels since June 2007 by flashing the 4.91% mark at the latest. The jump in the US Treasury bond yields portrays the market’s fears, which in turn probed bulls on Wall Street and weigh on S&P 500 Futures as of late.
With the risk-off mood and firmer yields, the US Dollar Index (DXY) bounces off a one-week low to 104.60 at the latest, up 0.17% intraday.
Looking ahead, a light calendar can restrict GBP/USD moves and may keep it southwards ahead of Friday’s key US ISM Services PMI and final readings of the UK S&P Global/CIPS Services PMI for February.
Unless providing a daily close beyond the one-month-old descending resistance line, around 1.2075 by the press time, the GBP/USD remains vulnerable to test an upward-sloping trend line from January 06, close to 1.1935 at the latest.
Technical Levels: Supports and Resistances
GBPUSD currently trading at 1.2006 at the time of writing. Pair opened at 1.2019 and is trading with a change of -0.11% % .
| Overview | Overview.1 | |
|---|---|---|
| 0 | Today last price | 1.2006 |
| 1 | Today Daily Change | -0.0013 |
| 2 | Today Daily Change % | -0.11% |
| 3 | Today daily open | 1.2019 |
The pair is trading below its 20 Daily moving average @ 1.2062, below its 50 Daily moving average @ 1.2143 , above its 100 Daily moving average @ 1.197 and above its 200 Daily moving average @ 1.1923
| Trends | Trends.1 | |
|---|---|---|
| 0 | Daily SMA20 | 1.2062 |
| 1 | Daily SMA50 | 1.2143 |
| 2 | Daily SMA100 | 1.1970 |
| 3 | Daily SMA200 | 1.1923 |
The previous day high was 1.209 while the previous day low was 1.1965. The daily 38.2% Fib levels comes at 1.2013, expected to provide resistance. Similarly, the daily 61.8% fib level is at 1.2042, expected to provide resistance.
Note the levels of interest below:
- Pivot support is noted at 1.1959, 1.19, 1.1835
- Pivot resistance is noted at 1.2084, 1.2149, 1.2208
| Levels | Levels.1 |
|---|---|
| Previous Daily High | 1.2090 |
| Previous Daily Low | 1.1965 |
| Previous Weekly High | 1.2148 |
| Previous Weekly Low | 1.1928 |
| Previous Monthly High | 1.2402 |
| Previous Monthly Low | 1.1915 |
| Daily Fibonacci 38.2% | 1.2013 |
| Daily Fibonacci 61.8% | 1.2042 |
| Daily Pivot Point S1 | 1.1959 |
| Daily Pivot Point S2 | 1.1900 |
| Daily Pivot Point S3 | 1.1835 |
| Daily Pivot Point R1 | 1.2084 |
| Daily Pivot Point R2 | 1.2149 |
| Daily Pivot Point R3 | 1.2208 |
[/s2If]
Join Our Telegram Group
")


