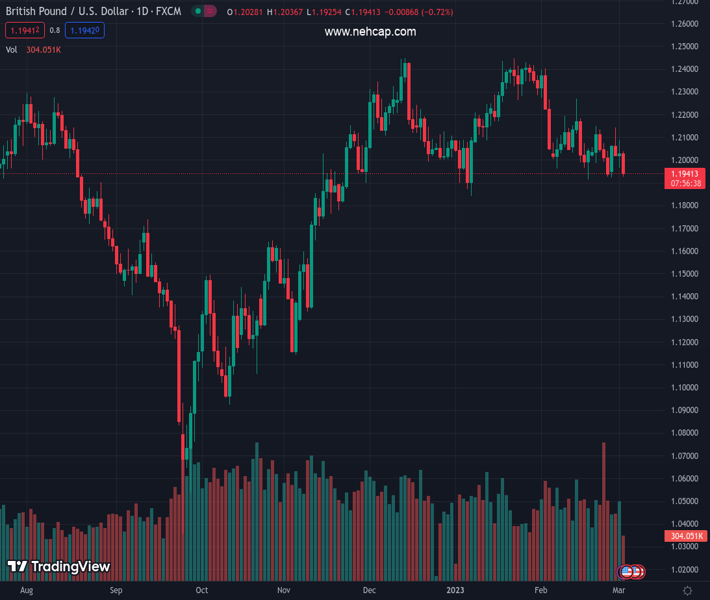
#GBPUSD @ 1.19333 meets with aggressive supply on Thursday and dives back closer to the weekly low. (Pivot Orderbook analysis)
…
This is a premium post.
[s2If !current_user_can(access_s2member_level4)]Please register for PREMIUM VERSION HERE to read full post below containing analysis. In case of any error or you think you are not able to read the full post below, please email us at support#nehcap.com [lwa][/s2If] [s2If current_user_can(access_s2member_level4)]
- GBP/USD meets with aggressive supply on Thursday and dives back closer to the weekly low.
- The setup favours bears and supports prospects for an eventual break below the 200 DMA.
- A sustained move beyond the 50-day SMA is needed to negate the near-term bearish outlook.
The pair currently trades last at 1.19333.
The previous day high was 1.209 while the previous day low was 1.1965. The daily 38.2% Fib levels comes at 1.2013, expected to provide resistance. Similarly, the daily 61.8% fib level is at 1.2042, expected to provide resistance.
The GBP/USD pair comes under intense selling pressure on Thursday and extends its intraday downward trajectory heading into the North American session. The pair is currently placed below the mid-1.1900s, down over 0.60% for the day, and remains well within the striking distance of the weekly low touched on Monday.
Looking at the broader picture, the GBP/USD pair is trading just above a technically significant 200-day Simple Moving Average (SMA) support, currently pegged around the 1.1920-1.1915 region. The said area coincides with the lower end of a short-term trading range witnessed over the past two weeks or so, which constitutes the formation of a rectangle on the daily chart.
Given that oscillators on the daily have just started gaining negative traction, a convincing break below a technically significant SMA will be seen as a fresh trigger for bearish traders. The GBP/USD could then slide towards retesting the YTD low, around the 1.1840 area set in January, which if broken will complete a bearish double-top pattern formed near the 1.2445-1.2450 region.
On the flip side, attempted recovery moves might now confront stiff resistance near the 1.2000 psychological mark ahead of the daily swing high, around the 1.2035 region and the 1.2065-1.2070 supply zone. Any subsequent move-up could attract fresh sellers near the 1.2100 mark and remain capped near the 50-day SMA strong barrier, currently around the 1.2135-1.2140 area.
Some follow-through buying has the potential to lift the GBP/USD pair towards the 1.2200 round-figure mark en route to the February 14 swing high, around the 1.2265-1.2270 region. A sustained strength beyond the latter will suggest that the slide from the 1.2445-1.2450 supply zone has run its course and shift the near-term bias back in favour of bullish traders.
Technical Levels: Supports and Resistances
GBPUSD currently trading at 1.1955 at the time of writing. Pair opened at 1.2019 and is trading with a change of -0.53 % .
| Overview | Overview.1 | |
|---|---|---|
| 0 | Today last price | 1.1955 |
| 1 | Today Daily Change | -0.0064 |
| 2 | Today Daily Change % | -0.5300 |
| 3 | Today daily open | 1.2019 |
The pair is trading below its 20 Daily moving average @ 1.2062, below its 50 Daily moving average @ 1.2143 , below its 100 Daily moving average @ 1.197 and above its 200 Daily moving average @ 1.1923
| Trends | Trends.1 | |
|---|---|---|
| 0 | Daily SMA20 | 1.2062 |
| 1 | Daily SMA50 | 1.2143 |
| 2 | Daily SMA100 | 1.1970 |
| 3 | Daily SMA200 | 1.1923 |
The previous day high was 1.209 while the previous day low was 1.1965. The daily 38.2% Fib levels comes at 1.2013, expected to provide resistance. Similarly, the daily 61.8% fib level is at 1.2042, expected to provide resistance.
Note the levels of interest below:
- Pivot support is noted at 1.1959, 1.19, 1.1835
- Pivot resistance is noted at 1.2084, 1.2149, 1.2208
| Levels | Levels.1 |
|---|---|
| Previous Daily High | 1.2090 |
| Previous Daily Low | 1.1965 |
| Previous Weekly High | 1.2148 |
| Previous Weekly Low | 1.1928 |
| Previous Monthly High | 1.2402 |
| Previous Monthly Low | 1.1915 |
| Daily Fibonacci 38.2% | 1.2013 |
| Daily Fibonacci 61.8% | 1.2042 |
| Daily Pivot Point S1 | 1.1959 |
| Daily Pivot Point S2 | 1.1900 |
| Daily Pivot Point S3 | 1.1835 |
| Daily Pivot Point R1 | 1.2084 |
| Daily Pivot Point R2 | 1.2149 |
| Daily Pivot Point R3 | 1.2208 |
[/s2If]
Join Our Telegram Group
")


