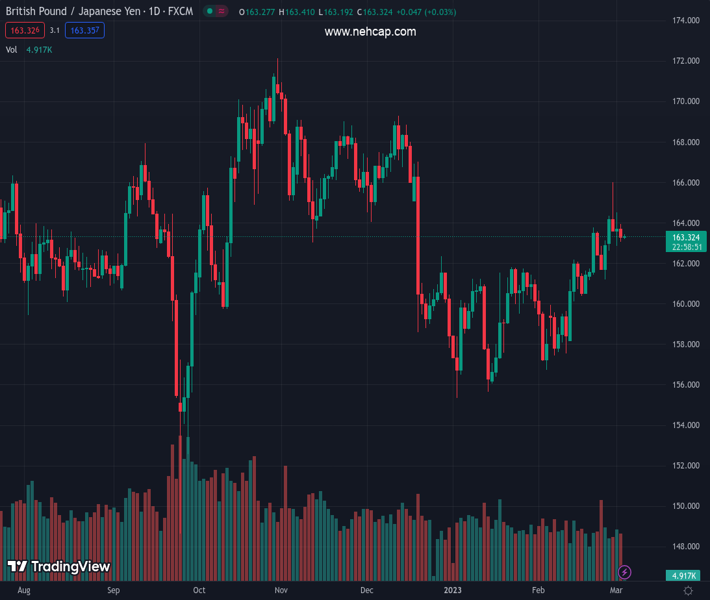
#GBPJPY @ 163.308 is about to finish the week almost flat. (Pivot Orderbook analysis)
…
This is a premium post.
[s2If !current_user_can(access_s2member_level4)]Please register for PREMIUM VERSION HERE to read full post below containing analysis. In case of any error or you think you are not able to read the full post below, please email us at support#nehcap.com [lwa][/s2If] [s2If current_user_can(access_s2member_level4)]
- GBP/JPY is about to finish the week almost flat.
- A multi-month downslope resistance trendline has held the GBP/JPY from re-testing YTD highs.
- GBP/JPY Price Analysis: Failure to crack 164.00 can pave the way for further downside.
The pair currently trades last at 163.308.
The previous day high was 164.51 while the previous day low was 162.87. The daily 38.2% Fib levels comes at 163.5, expected to provide resistance. Similarly, the daily 61.8% fib level is at 163.89, expected to provide resistance.
The GBP/JPY was rejected around 163.90s, dropping towards the mid 163.00-164.00 range as the Asian Pacific session is about to begin. A risk-off impulse in the FX space spurred a flight to safe-haven peers, like the Japanese Yen (JPY). At the time of typing, the GBP/JPY exchanges hands at 163.30.
After peaking in the week around 166.00, the GBP/JPY lost traction and extended its losses below 164.00, but the bias is still neutral to upwards. The 20-day Exponential Moving Average (EMA) at 162.00 is aiming north, 16 pips shy of the 100-day EMA. Once cleared, the GBP/JPY could continue to aim higher, but it is facing solid resistance at a five-month-old downslope resistance trendline at around 164.00.
The GBP/JPY needs to crack the trendline for a bullish continuation. Achievement of that, the GBP/JPY next resistance would be the psychological 165.00 figure, followed by the YTD high at 166.00.
Conversely, the GBP/JPY first support would be an upslope trendline drawn from mid-February. A breach of the latter will expose the 100-day Exponential Moving Average (EMA) at 162.16, followed by the 20-day EMA at 162.00.
Technical Levels: Supports and Resistances
GBPJPY currently trading at 163.35 at the time of writing. Pair opened at 163.67 and is trading with a change of -0.2 % .
| Overview | Overview.1 | |
|---|---|---|
| 0 | Today last price | 163.35 |
| 1 | Today Daily Change | -0.32 |
| 2 | Today Daily Change % | -0.20 |
| 3 | Today daily open | 163.67 |
The pair is trading above its 20 Daily moving average @ 160.97, above its 50 Daily moving average @ 160.19 , below its 100 Daily moving average @ 163.64 and below its 200 Daily moving average @ 163.41
| Trends | Trends.1 | |
|---|---|---|
| 0 | Daily SMA20 | 160.97 |
| 1 | Daily SMA50 | 160.19 |
| 2 | Daily SMA100 | 163.64 |
| 3 | Daily SMA200 | 163.41 |
The previous day high was 164.51 while the previous day low was 162.87. The daily 38.2% Fib levels comes at 163.5, expected to provide resistance. Similarly, the daily 61.8% fib level is at 163.89, expected to provide resistance.
Note the levels of interest below:
- Pivot support is noted at 162.85, 162.04, 161.21
- Pivot resistance is noted at 164.5, 165.33, 166.15
| Levels | Levels.1 |
|---|---|
| Previous Daily High | 164.51 |
| Previous Daily Low | 162.87 |
| Previous Weekly High | 163.76 |
| Previous Weekly Low | 161.17 |
| Previous Monthly High | 166.01 |
| Previous Monthly Low | 156.73 |
| Daily Fibonacci 38.2% | 163.50 |
| Daily Fibonacci 61.8% | 163.89 |
| Daily Pivot Point S1 | 162.85 |
| Daily Pivot Point S2 | 162.04 |
| Daily Pivot Point S3 | 161.21 |
| Daily Pivot Point R1 | 164.50 |
| Daily Pivot Point R2 | 165.33 |
| Daily Pivot Point R3 | 166.15 |
[/s2If]
Join Our Telegram Group
")


