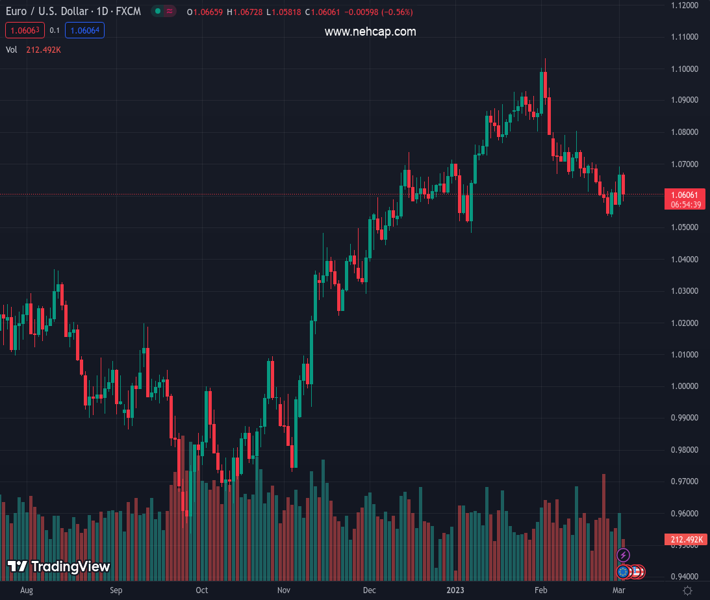
#EURUSD @ 1.06054 comes under heavy pressure and breaches 1.0600. (Pivot Orderbook analysis)
…
This is a premium post.
[s2If !current_user_can(access_s2member_level4)]Please register for PREMIUM VERSION HERE to read full post below containing analysis. In case of any error or you think you are not able to read the full post below, please email us at support#nehcap.com [lwa][/s2If] [s2If current_user_can(access_s2member_level4)]
- EUR/USD comes under heavy pressure and breaches 1.0600.
- Extra losses seem in place while below the 55-day SMA at 1.0713.
The pair currently trades last at 1.06054.
The previous day high was 1.0692 while the previous day low was 1.0565. The daily 38.2% Fib levels comes at 1.0643, expected to provide resistance. Similarly, the daily 61.8% fib level is at 1.0614, expected to provide resistance.
EUR/USD quickly fades the Wednesday’s uptick and returns to the sub-1.0600 region on Thursday.
While below the temporary up barrier at the 55-day SMA, today at 1.0713, the pair remains vulnerable to further losses. Against that, another visit to the February low at 1.0532 (February 27) should not be ruled out.
Looking at the longer run, the constructive view remains unchanged while above the 200-day SMA, today at 1.0327.
Technical Levels: Supports and Resistances
EURUSD currently trading at 1.0594 at the time of writing. Pair opened at 1.0665 and is trading with a change of -0.67 % .
| Overview | Overview.1 | |
|---|---|---|
| 0 | Today last price | 1.0594 |
| 1 | Today Daily Change | 91.0000 |
| 2 | Today Daily Change % | -0.6700 |
| 3 | Today daily open | 1.0665 |
The pair is trading below its 20 Daily moving average @ 1.0687, below its 50 Daily moving average @ 1.0726 , above its 100 Daily moving average @ 1.0478 and above its 200 Daily moving average @ 1.033
| Trends | Trends.1 | |
|---|---|---|
| 0 | Daily SMA20 | 1.0687 |
| 1 | Daily SMA50 | 1.0726 |
| 2 | Daily SMA100 | 1.0478 |
| 3 | Daily SMA200 | 1.0330 |
The previous day high was 1.0692 while the previous day low was 1.0565. The daily 38.2% Fib levels comes at 1.0643, expected to provide resistance. Similarly, the daily 61.8% fib level is at 1.0614, expected to provide resistance.
Note the levels of interest below:
- Pivot support is noted at 1.059, 1.0515, 1.0464
- Pivot resistance is noted at 1.0716, 1.0767, 1.0842
| Levels | Levels.1 |
|---|---|
| Previous Daily High | 1.0692 |
| Previous Daily Low | 1.0565 |
| Previous Weekly High | 1.0705 |
| Previous Weekly Low | 1.0536 |
| Previous Monthly High | 1.1033 |
| Previous Monthly Low | 1.0533 |
| Daily Fibonacci 38.2% | 1.0643 |
| Daily Fibonacci 61.8% | 1.0614 |
| Daily Pivot Point S1 | 1.0590 |
| Daily Pivot Point S2 | 1.0515 |
| Daily Pivot Point S3 | 1.0464 |
| Daily Pivot Point R1 | 1.0716 |
| Daily Pivot Point R2 | 1.0767 |
| Daily Pivot Point R3 | 1.0842 |
[/s2If]
Join Our Telegram Group
")


