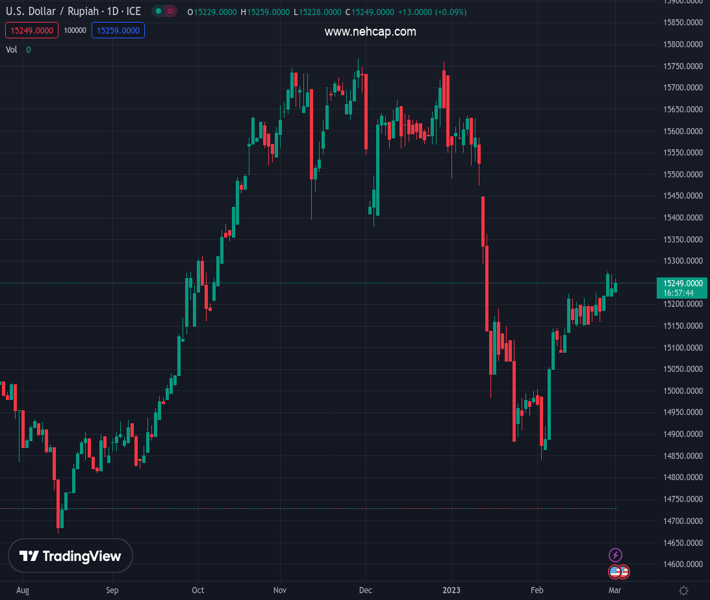
#USDIDR @ 15,250.0 remains mildly bid for the second consecutive day despite upbeat Indonesia Inflation. (Pivot Orderbook analysis)
…
This is a premium post.
[s2If !current_user_can(access_s2member_level4)]Please register for PREMIUM VERSION HERE to read full post below containing analysis. In case of any error or you think you are not able to read the full post below, please email us at support#nehcap.com [lwa][/s2If] [s2If current_user_can(access_s2member_level4)]
- USD/IDR remains mildly bid for the second consecutive day despite upbeat Indonesia Inflation.
- Indonesia Inflation and Core Inflation both grew more than expected in February.
- Upbeat yields challenge US Dollar’s retreat after the biggest monthly gains since September 2022.
- US PMIs, risk catalysts eyed for immediate directions, Fed talks will be the key.
The pair currently trades last at 15250.0.
The previous day high was 15380.05 while the previous day low was 15209.0. The daily 38.2% Fib levels comes at 15314.7089, expected to provide resistance. Similarly, the daily 61.8% fib level is at 15274.3411, expected to provide resistance.
USD/IDR struggles to justify strong Indonesia Inflation early Wednesday as it picks up bid to $15,560 during the two-day uptrend at the latest. The reason could be linked to the mixed sentiment in the markets as traders brace for the key March month.
Indonesia’s Inflation grew 5.47% YoY versus 5.44% expected and 5.28% prior but the MoM figures eased to 0.16% from 0.34% previous readings while crossing 0.11% market consensus. Further, Core Inflation dropped to 3.09% during the stated month versus 3.26% estimations and 3.27% prior.
Apart from the Indonesian inflation data, strong China PMI also should have favored the market sentiment and weighed on the USD/IDR prices. However, anxiety ahead of the key data/events, as well as firmer US Treasury bond yields seems to propel the USD/IDR prices.
That said, China’s Caixin Manufacturing PMI traces official activity data per NBS Manufacturing and Non-Manufacturing PMI to mark a strong economic rebound in February. Even so, China Finance Minister Liu He said after the data release that the foundation of China’s economic recovery is still not stable.
Amid these plays, the S&P 500 Futures trace Wall Street’s mild losses around 3,960. Further, the US 10-year Treasury bond yields rose two basis points (bps) to 3.93% while the two-year counterpart rises four bps to 4.84% by the press time. With this, both the key bond coupons march towards the three-month high marked in February after printing the biggest monthly gain since September 2022.
Looking ahead, US S&P Global and ISM PMIs for February could direct immediate moves but major attention will be given to the next week’s monthly jobs report, Federal Reserve (Fed) Chairman Jerome Powell’s testimony and the Federal Open Market Committee (FOMC) monetary policy meeting for clear directions.
Despite the latest run-up, the USD/IDR bulls need validation from the 50-DMA, as well as an upward-sloping resistance line from the mid-January, respectively near $15,265 and $15,300, to push back the bearish bias.
Technical Levels: Supports and Resistances
USDIDR currently trading at 15255 at the time of writing. Pair opened at 15239.95 and is trading with a change of 0.10% % .
| Overview | Overview.1 | |
|---|---|---|
| 0 | Today last price | 15255 |
| 1 | Today Daily Change | 15.0500 |
| 2 | Today Daily Change % | 0.10% |
| 3 | Today daily open | 15239.95 |
The pair is trading above its 20 Daily moving average @ 15160.5875, below its 50 Daily moving average @ 15271.6 , below its 100 Daily moving average @ 15430.197 and above its 200 Daily moving average @ 15160.3392
| Trends | Trends.1 | |
|---|---|---|
| 0 | Daily SMA20 | 15160.5875 |
| 1 | Daily SMA50 | 15271.6000 |
| 2 | Daily SMA100 | 15430.1970 |
| 3 | Daily SMA200 | 15160.3392 |
The previous day high was 15380.05 while the previous day low was 15209.0. The daily 38.2% Fib levels comes at 15314.7089, expected to provide resistance. Similarly, the daily 61.8% fib level is at 15274.3411, expected to provide resistance.
Note the levels of interest below:
- Pivot support is noted at 15172.6167, 15105.2833, 15001.5667
- Pivot resistance is noted at 15343.6667, 15447.3833, 15514.7167
| Levels | Levels.1 |
|---|---|
| Previous Daily High | 15380.0500 |
| Previous Daily Low | 15209.0000 |
| Previous Weekly High | 15279.0000 |
| Previous Weekly Low | 15117.0500 |
| Previous Monthly High | 15380.0500 |
| Previous Monthly Low | 14835.0000 |
| Daily Fibonacci 38.2% | 15314.7089 |
| Daily Fibonacci 61.8% | 15274.3411 |
| Daily Pivot Point S1 | 15172.6167 |
| Daily Pivot Point S2 | 15105.2833 |
| Daily Pivot Point S3 | 15001.5667 |
| Daily Pivot Point R1 | 15343.6667 |
| Daily Pivot Point R2 | 15447.3833 |
| Daily Pivot Point R3 | 15514.7167 |
[/s2If]
Join Our Telegram Group
")


