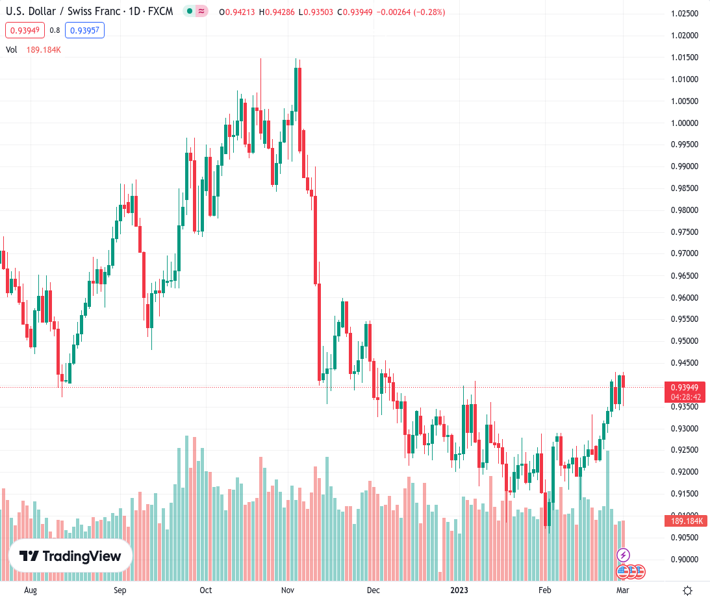
#USDCHF @ 0.93921 is trapped within the 0.9340-0.9425 region for the fourth straight day. (Pivot Orderbook analysis)
…
This is a premium post.
[s2If !current_user_can(access_s2member_level4)]Please register for PREMIUM VERSION HERE to read full post below containing analysis. In case of any error or you think you are not able to read the full post below, please email us at support#nehcap.com [lwa][/s2If] [s2If current_user_can(access_s2member_level4)]
- USD/CHF is trapped within the 0.9340-0.9425 region for the fourth straight day.
- USD/CHF Price Analysis: Negative divergence in the 4-hour chart opened the door for further losses.
The pair currently trades last at 0.93921.
The previous day high was 0.942 while the previous day low was 0.9342. The daily 38.2% Fib levels comes at 0.939, expected to provide support. Similarly, the daily 61.8% fib level is at 0.9371, expected to provide support.
The USD/CHF is trimming some of Tuesday’s gains, dropping slightly above the 100-day Exponential Moving Average (EMA), which sits at 0.9384, after hitting a daily high of 0.9428. At the time of writing, the USD/CHF exchanges hands at 0.9387, below its opening price by 0.36%.
Since the start of the week, the USD/CHF remains range-bound within the 0.9340-0.9425 area. The Relative Strength Index (RSI) portrays buyers in charge, but its slope turned south, suggesting pressure is waning.
The USD/CHF 4-hour chart paints a different picture. As price action edged up, the RSI reached lower peaks. That means a negative divergence has formed, which usually anticipates a reversal. However, the USD/CHF would face solid support levels, as the EMAs are resting below the spot price.
Therefore, the USD/CHF first support would be the 20-EMA at 0.9374. A breach of the latter will expose the weekly low of 0.9341, followed by the 50-EMA at 0.9335, ahead of testing the 0.9300 mark. Once cleared, the next stop for USD/CHF sellers would be the 100-EMA at 0.9295, closely followed by the 200-EMA at 0.9278.
Technical Levels: Supports and Resistances
USDCHF currently trading at 0.9387 at the time of writing. Pair opened at 0.9418 and is trading with a change of -0.33 % .
| Overview | Overview.1 | |
|---|---|---|
| 0 | Today last price | 0.9387 |
| 1 | Today Daily Change | -0.0031 |
| 2 | Today Daily Change % | -0.3300 |
| 3 | Today daily open | 0.9418 |
The pair is trading above its 20 Daily moving average @ 0.9257, above its 50 Daily moving average @ 0.9255 , below its 100 Daily moving average @ 0.9453 and below its 200 Daily moving average @ 0.957
| Trends | Trends.1 | |
|---|---|---|
| 0 | Daily SMA20 | 0.9257 |
| 1 | Daily SMA50 | 0.9255 |
| 2 | Daily SMA100 | 0.9453 |
| 3 | Daily SMA200 | 0.9570 |
The previous day high was 0.942 while the previous day low was 0.9342. The daily 38.2% Fib levels comes at 0.939, expected to provide support. Similarly, the daily 61.8% fib level is at 0.9371, expected to provide support.
Note the levels of interest below:
- Pivot support is noted at 0.9366, 0.9315, 0.9288
- Pivot resistance is noted at 0.9445, 0.9471, 0.9523
| Levels | Levels.1 |
|---|---|
| Previous Daily High | 0.9420 |
| Previous Daily Low | 0.9342 |
| Previous Weekly High | 0.9409 |
| Previous Weekly Low | 0.9221 |
| Previous Monthly High | 0.9429 |
| Previous Monthly Low | 0.9059 |
| Daily Fibonacci 38.2% | 0.9390 |
| Daily Fibonacci 61.8% | 0.9371 |
| Daily Pivot Point S1 | 0.9366 |
| Daily Pivot Point S2 | 0.9315 |
| Daily Pivot Point S3 | 0.9288 |
| Daily Pivot Point R1 | 0.9445 |
| Daily Pivot Point R2 | 0.9471 |
| Daily Pivot Point R3 | 0.9523 |
[/s2If]
Join Our Telegram Group
")


