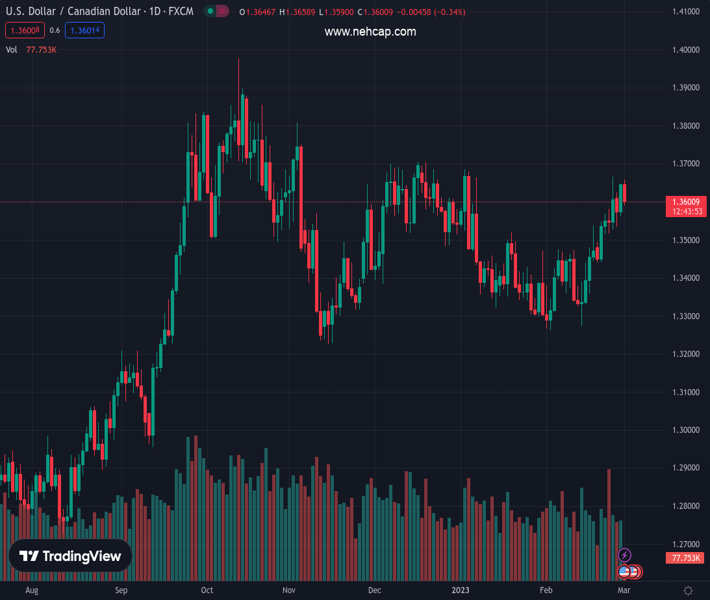
#USDCAD @ 1.35972 meets with a fresh supply on Wednesday and is pressured by a combination of factors. (Pivot Orderbook analysis)
…
This is a premium post.
[s2If !current_user_can(access_s2member_level4)]Please register for PREMIUM VERSION HERE to read full post below containing analysis. In case of any error or you think you are not able to read the full post below, please email us at support#nehcap.com [lwa][/s2If] [s2If current_user_can(access_s2member_level4)]
- USD/CAD meets with a fresh supply on Wednesday and is pressured by a combination of factors.
- Rising Crude Oil prices underpin the Loonie and weigh on the pair amid a sharp USD pullback.
- Looming recession risks, hawkish Fed expectations could limit the USD losses and lend support.
The pair currently trades last at 1.35972.
The previous day high was 1.3646 while the previous day low was 1.3561. The daily 38.2% Fib levels comes at 1.3614, expected to provide resistance. Similarly, the daily 61.8% fib level is at 1.3593, expected to provide support.
The USD/CAD pair comes under heavy selling pressure following an early uptick to the 1.3660 area, or a fresh weekly high on Wednesday and erodes a part of the previous day’s strong gains. The pair maintains its offered tone through the first half of the European session and is currently placed near the lower end of the daily range, just below the 1.3600 mark.
Crude Oil prices gain positive traction for the second successive day, which underpins the commodity-linked Loonie and weighs on the USD/CAD pair. The upbeat Chinese PMI prints for February lifted hopes that recovery in the world’s second-largest economy is gaining steam and boosted the outlook for fuel demand. Apart from this, the prospects for lower exports from Russia lend support to the black liquid.
The latest optimism, meanwhile, leads to a modest recovery in the global risk sentiment and triggers a sharp US Dollar corrective pullback from a multi-week high. This is seen as another factor contributing to the USD/CAD pair’s intraday decline. That said, signs of rising crude stockpiles in the United States – the world’s biggest oil consumer – and increasing supply from OPEC could cap any further gains for Oil prices.
According to sources, citing American Petroleum Institute (API) figures on Tuesday, US oil inventories rose by 6.2 million barrels in the week ended February 24. Adding to this, a Reuters survey found that OPEC pumped 28.97 million barrels per day (bpd) in February, up by 150,000 bpd from January. Investors also seem worried that the rising borrowing costs will dampen economic growth and dent fuel demand.
Furthermore, hawkish Fed expectations should help limit deeper losses for the Greenback and lend support to the USD/CAD pair. The markets now seem convinced that the US central bank will stick to its hawkish stance for longer in the wake of stubbornly high inflation. This remains supportive of elevated US Treasury bond yields and supports prospects for the emergence of some dip-buying around the USD.
Hence, it will be prudent to wait for strong follow-through selling before confirming that the USD/CAD pair has formed a near-term top ahead of the 1.3600 mark and placing fresh bearish bets. Traders now look to the US ISM Manufacturing PMI, which could influence the USD demand. Apart from this, Oil price dynamics could provide some impetus to the major and produce short-term trading opportunities.
Technical Levels: Supports and Resistances
USDCAD currently trading at 1.3598 at the time of writing. Pair opened at 1.3646 and is trading with a change of -0.35 % .
| Overview | Overview.1 | |
|---|---|---|
| 0 | Today last price | 1.3598 |
| 1 | Today Daily Change | -0.0048 |
| 2 | Today Daily Change % | -0.3500 |
| 3 | Today daily open | 1.3646 |
The pair remains strongly bullish on the daily timeframe. It trades above its 20 SMA @ 1.3451, 50 SMA 1.346, 100 SMA @ 1.3508 and 200 SMA @ 1.3272.
| Trends | Trends.1 | |
|---|---|---|
| 0 | Daily SMA20 | 1.3451 |
| 1 | Daily SMA50 | 1.3460 |
| 2 | Daily SMA100 | 1.3508 |
| 3 | Daily SMA200 | 1.3272 |
The previous day high was 1.3646 while the previous day low was 1.3561. The daily 38.2% Fib levels comes at 1.3614, expected to provide resistance. Similarly, the daily 61.8% fib level is at 1.3593, expected to provide support.
Note the levels of interest below:
- Pivot support is noted at 1.3589, 1.3532, 1.3504
- Pivot resistance is noted at 1.3674, 1.3703, 1.376
| Levels | Levels.1 |
|---|---|
| Previous Daily High | 1.3646 |
| Previous Daily Low | 1.3561 |
| Previous Weekly High | 1.3666 |
| Previous Weekly Low | 1.3441 |
| Previous Monthly High | 1.3666 |
| Previous Monthly Low | 1.3262 |
| Daily Fibonacci 38.2% | 1.3614 |
| Daily Fibonacci 61.8% | 1.3593 |
| Daily Pivot Point S1 | 1.3589 |
| Daily Pivot Point S2 | 1.3532 |
| Daily Pivot Point S3 | 1.3504 |
| Daily Pivot Point R1 | 1.3674 |
| Daily Pivot Point R2 | 1.3703 |
| Daily Pivot Point R3 | 1.3760 |
[/s2If]
Join Our Telegram Group
")


