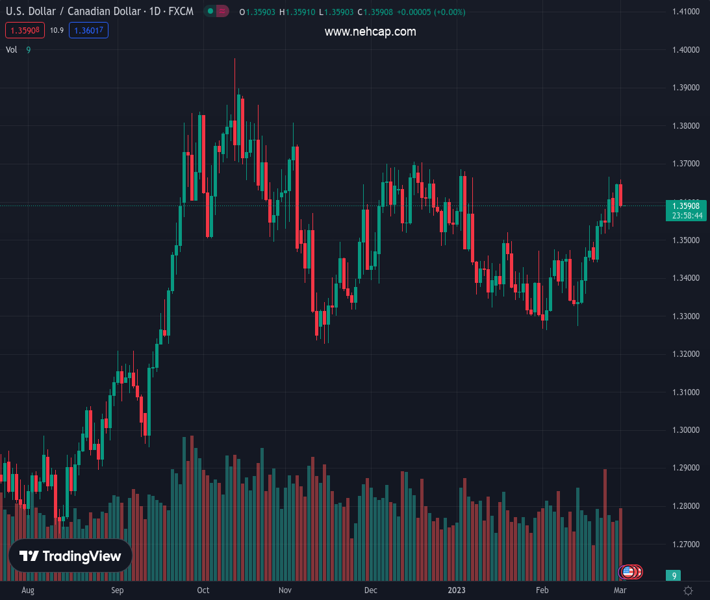
#USDCAD @ 1.35903 retreats from daily and weekly highs as the Asian session is about to begin. (Pivot Orderbook analysis)
…
This is a premium post.
[s2If !current_user_can(access_s2member_level4)]Please register for PREMIUM VERSION HERE to read full post below containing analysis. In case of any error or you think you are not able to read the full post below, please email us at support#nehcap.com [lwa][/s2If] [s2If current_user_can(access_s2member_level4)]
- USD/CAD retreats from daily and weekly highs as the Asian session is about to begin.
- Despite dipping, oscillators remain bullish, meaning that further USD/CAD upside is expected.
- USD/CAD Price Analysis: Bullish reclaiming of 1.3600 could trigger a rally towards 1.3800.
The pair currently trades last at 1.35903.
The previous day high was 1.3646 while the previous day low was 1.3561. The daily 38.2% Fib levels comes at 1.3614, expected to provide resistance. Similarly, the daily 61.8% fib level is at 1.3593, expected to provide resistance.
The USD/CAD tumbled from weekly highs around 1.3658, dropping nearly 0.40%, as Wall Street closed with losses, while the greenback remained offered throughout the session. US economic data was mixed, though a subcomponent of the ISM Manufacturing PMI report for February sparked inflation fears in the United States (US). At the time of writing, the USD/CAD exchanges hands at 1.3594.
The USD/CAD is upward biased despite dipping below 1.3600, in a fall sponsored by overall US Dollar weakness. Technically speaking, the USD/CAD pair’s failure to print a lower low than Tuesday’s 1.3560 kept the uptrend intact, even though the Relative Strength Index (RSI) shifted downwards.
For a bearish continuation, USD/CAD sellers must achieve a daily close below 1.3560. Once that is achieved, the USD/CAD next support would be the January 19 daily high turned support at 1.3520, ahead of testing the 1.3500 psychological level.
On the other hand, and in the most likely scenario, the USD/CAD first resistance would be the 1.3600 psychological level. A breach of the latter will expose the year-to-date (YTD) high at 1.3665, followed by the 1.3700 figure, and then the November 3 daily high at 1.3808.
Technical Levels: Supports and Resistances
USDCAD currently trading at 1.3594 at the time of writing. Pair opened at 1.3646 and is trading with a change of -0.38 % .
| Overview | Overview.1 | |
|---|---|---|
| 0 | Today last price | 1.3594 |
| 1 | Today Daily Change | -0.0052 |
| 2 | Today Daily Change % | -0.3800 |
| 3 | Today daily open | 1.3646 |
The pair remains strongly bullish on the daily timeframe. It trades above its 20 SMA @ 1.3451, 50 SMA 1.346, 100 SMA @ 1.3508 and 200 SMA @ 1.3272.
| Trends | Trends.1 | |
|---|---|---|
| 0 | Daily SMA20 | 1.3451 |
| 1 | Daily SMA50 | 1.3460 |
| 2 | Daily SMA100 | 1.3508 |
| 3 | Daily SMA200 | 1.3272 |
The previous day high was 1.3646 while the previous day low was 1.3561. The daily 38.2% Fib levels comes at 1.3614, expected to provide resistance. Similarly, the daily 61.8% fib level is at 1.3593, expected to provide resistance.
Note the levels of interest below:
- Pivot support is noted at 1.3589, 1.3532, 1.3504
- Pivot resistance is noted at 1.3674, 1.3703, 1.376
| Levels | Levels.1 |
|---|---|
| Previous Daily High | 1.3646 |
| Previous Daily Low | 1.3561 |
| Previous Weekly High | 1.3666 |
| Previous Weekly Low | 1.3441 |
| Previous Monthly High | 1.3666 |
| Previous Monthly Low | 1.3262 |
| Daily Fibonacci 38.2% | 1.3614 |
| Daily Fibonacci 61.8% | 1.3593 |
| Daily Pivot Point S1 | 1.3589 |
| Daily Pivot Point S2 | 1.3532 |
| Daily Pivot Point S3 | 1.3504 |
| Daily Pivot Point R1 | 1.3674 |
| Daily Pivot Point R2 | 1.3703 |
| Daily Pivot Point R3 | 1.3760 |
[/s2If]
Join Our Telegram Group
")


