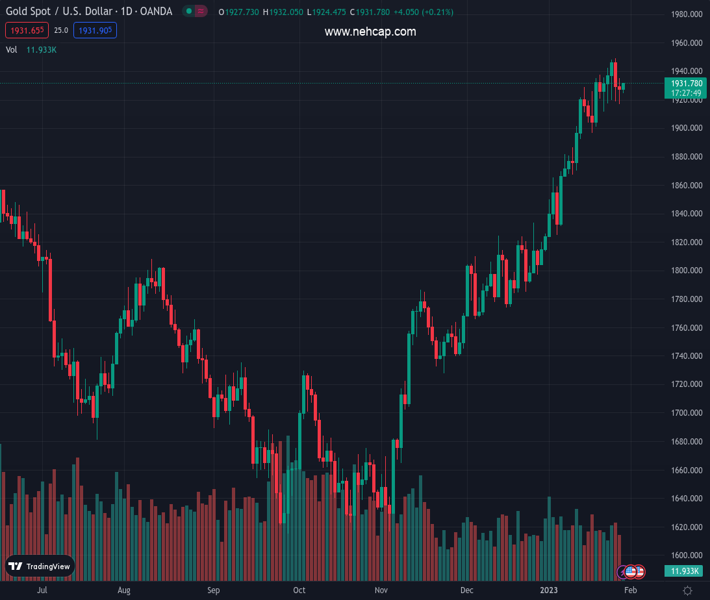
#XAUUSD @ 1,931.59 Gold price bounces off intraday low but stays directionless after closely missing the bear’s entry in the week., @nehcap view: Further weakness expected (Pivot Orderbook analysis)
…
This is a premium post.
[s2If !current_user_can(access_s2member_level4)]Please register for PREMIUM VERSION HERE to read full post below containing analysis. In case of any error or you think you are not able to read the full post below, please email us at support#nehcap.com [lwa][/s2If] [s2If current_user_can(access_s2member_level4)]
- Gold price bounces off intraday low but stays directionless after closely missing the bear’s entry in the week.
- China’s return boosts Asia-Pacific shares, S&P 500 Futures bear the burden of firmer yields.
- XAU/USD bulls appear running out of steam even as Fed’s dovish hike, downbeat expectations from US NFP probe bears.
The pair currently trades last at 1931.59.
The previous day high was 1935.1 while the previous day low was 1916.73. The daily 38.2% Fib levels comes at 1923.75, expected to provide support. Similarly, the daily 61.8% fib level is at 1928.08, expected to provide support.
Gold price (XAU/USD) aptly portrays the market’s cautious mood ahead of top-tier data/events during early Monday.
The metal rose in the last six weeks before losing the upside momentum at the latest. The reason for the quote’s recent sluggish moves could be linked to the market’s indecision as major central bank events and the US jobs report occupy the weekly economic calendar.
It’s worth noting that China’s return from the one-week-long Lunar New Year (LNY) holidays bring some good news as the nation’s Center for Disease Control and Prevention (CDC) signaled the end of the Covid wave. On the same line could be the could jump in the Chinese festive demand, of around 12.2% versus the year ago, as well as readiness to bolster economic growth via lending tools, spending and higher imports.
Elsewhere, mixed concerns surrounding the US inflation and growth challenge the Federal Reserve (Fed) in defending its hawkish policy, which in turn keeps the Gold buyers hopeful. Furthermore, the European Central Bank’s (ECB) comparatively more hawkish stand probes the US Dollar’s latest rebound and hence exerts downside pressure on the XAU/USD.
Amid these plays, the US Treasury bond yields grind higher but the stock futures print mild losses. Furthermore, the Asia-Pacific shares grind higher but the US Dollar Index (DXY) struggles to extend a two-day recovery.
Looking forward, January’s official PMIs from China, up for publishing on Tuesday, could offer immediate directions to Gold price ahead of Wednesday’s Fed meeting and Friday’s US jobs report. Overall, the Fed’s inability to convince hawks could weigh on the pair.
Gold price fades the previous day’s bounce off a one-month-old ascending support line, taking rounds to the 50-Simple Moving Average (SMA) level surrounding $1,928 by the press time.
Although the receding bearish bias of the MACD and multiple bounces off the aforementioned support line defends the XAU/USD buyers. Steady RSI (14) and recently sluggish momentum teases Gold sellers of late.
That said, a clear downside break of the stated support line, close to $1,920 by the press time, appears necessary for the Gold sellers to take entry.
Following that, the $1,900 threshold and the January 18 swing low near $1,896 could lure the XAU/USD bears.
Alternatively, Gold buyers need to cross the one-week-old horizontal hurdle of around $1,945 to retake control.
Trend: Further weakness expected
Technical Levels: Supports and Resistances
XAUUSD currently trading at 1930.4 at the time of writing. Pair opened at 1926.68 and is trading with a change of 0.19% % .
| Overview | Overview.1 | |
|---|---|---|
| 0 | Today last price | 1930.4 |
| 1 | Today Daily Change | 3.72 |
| 2 | Today Daily Change % | 0.19% |
| 3 | Today daily open | 1926.68 |
The pair remains strongly bullish on the daily timeframe. It trades above its 20 SMA @ 1896.14, 50 SMA 1829.25, 100 SMA @ 1755.29 and 200 SMA @ 1775.48.
| Trends | Trends.1 | |
|---|---|---|
| 0 | Daily SMA20 | 1896.14 |
| 1 | Daily SMA50 | 1829.25 |
| 2 | Daily SMA100 | 1755.29 |
| 3 | Daily SMA200 | 1775.48 |
The previous day high was 1935.1 while the previous day low was 1916.73. The daily 38.2% Fib levels comes at 1923.75, expected to provide support. Similarly, the daily 61.8% fib level is at 1928.08, expected to provide support.
Note the levels of interest below:
- Pivot support is noted at 1917.24, 1907.8, 1898.87
- Pivot resistance is noted at 1935.61, 1944.54, 1953.98
| Levels | Levels.1 |
|---|---|
| Previous Daily High | 1935.10 |
| Previous Daily Low | 1916.73 |
| Previous Weekly High | 1949.27 |
| Previous Weekly Low | 1911.45 |
| Previous Monthly High | 1833.38 |
| Previous Monthly Low | 1765.89 |
| Daily Fibonacci 38.2% | 1923.75 |
| Daily Fibonacci 61.8% | 1928.08 |
| Daily Pivot Point S1 | 1917.24 |
| Daily Pivot Point S2 | 1907.80 |
| Daily Pivot Point S3 | 1898.87 |
| Daily Pivot Point R1 | 1935.61 |
| Daily Pivot Point R2 | 1944.54 |
| Daily Pivot Point R3 | 1953.98 |
[/s2If]
Join Our Telegram Group
")


