#XAGUSD @ 23.652 Silver price fades the previous week’s bounce off 50-DMA, stays depressed around intraday low., @nehcap view: Further weakness expected (Pivot Orderbook analysis)
…
This is a premium post.
[s2If !current_user_can(access_s2member_level4)]Please register for PREMIUM VERSION HERE to read full post below containing analysis. In case of any error or you think you are not able to read the full post below, please email us at support#nehcap.com [lwa][/s2If] [s2If current_user_can(access_s2member_level4)]
- Silver price fades the previous week’s bounce off 50-DMA, stays depressed around intraday low.
- Bearish Doji, downbeat MACD signals keep silver sellers hopeful.
- XAG/USD moves remain sidelined inside five-week-old horizontal region.
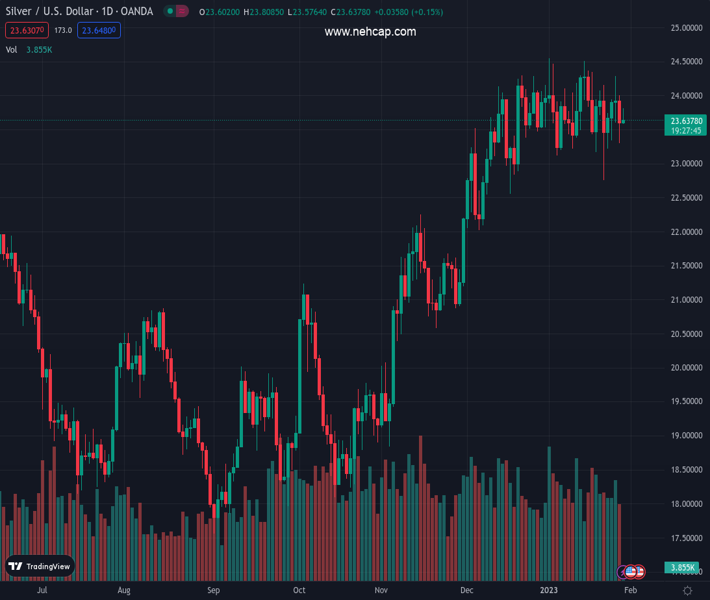
The pair currently trades last at 23.652.
The previous day high was 24.01 while the previous day low was 23.3. The daily 38.2% Fib levels comes at 23.57, expected to provide support. Similarly, the daily 61.8% fib level is at 23.74, expected to provide resistance.
Silver price (XAG/USD) holds lower ground near $23.60 as the metal traders brace for a busy week during early Monday. In doing so, the bright metal remains inside a five-week-old horizontal trading region between $24.40 and $23.10.
It’s worth noting, however, that Thursday’s bearish Doji candlestick joins bearish MACD signals to weigh on the Silver prices.
Even so, the 50-DMA and the stated horizontal region’s support, respectively near $23.25 and $23.10, restrict short-term XAG/USD downside.
In a case where the Silver price remains weaker past $23.10, and also breaks the $23.00 round figure, the 50% and 61.8% Fibonacci retracement level of the commodity’s November 2022 to early January 2023 upside, close to $22.55 and $22.10 in that order, will be important challenges for the XAG/USD bears to tackle.
Alternatively, the $24.00 round figure could test the immediate upside of the XAG/USD ahead of directing the Silver buyers towards the stated trading range’s upper boundary, close to $24.40.
Following that, the monthly high surrounding $24.55 could act as an extra filter towards the north ahead of fueling the XAG/USD towards the April 2022 top near $26.25.
Overall, the Silver price remains bearish unless crossing $24.40. However, the downside room appears limited.
Trend: Further weakness expected
Technical Levels: Supports and Resistances
XAGUSD currently trading at 23.62 at the time of writing. Pair opened at 23.56 and is trading with a change of 0.25% % .
| Overview | Overview.1 | |
|---|---|---|
| 0 | Today last price | 23.62 |
| 1 | Today Daily Change | 0.06 |
| 2 | Today Daily Change % | 0.25% |
| 3 | Today daily open | 23.56 |
The pair is trading below its 20 Daily moving average @ 23.77, above its 50 Daily moving average @ 23.21 , above its 100 Daily moving average @ 21.49 and above its 200 Daily moving average @ 21.01
| Trends | Trends.1 | |
|---|---|---|
| 0 | Daily SMA20 | 23.77 |
| 1 | Daily SMA50 | 23.21 |
| 2 | Daily SMA100 | 21.49 |
| 3 | Daily SMA200 | 21.01 |
The previous day high was 24.01 while the previous day low was 23.3. The daily 38.2% Fib levels comes at 23.57, expected to provide support. Similarly, the daily 61.8% fib level is at 23.74, expected to provide resistance.
Note the levels of interest below:
- Pivot support is noted at 23.24, 22.92, 22.53
- Pivot resistance is noted at 23.95, 24.33, 24.66
| Levels | Levels.1 |
|---|---|
| Previous Daily High | 24.01 |
| Previous Daily Low | 23.30 |
| Previous Weekly High | 24.30 |
| Previous Weekly Low | 22.76 |
| Previous Monthly High | 24.30 |
| Previous Monthly Low | 22.03 |
| Daily Fibonacci 38.2% | 23.57 |
| Daily Fibonacci 61.8% | 23.74 |
| Daily Pivot Point S1 | 23.24 |
| Daily Pivot Point S2 | 22.92 |
| Daily Pivot Point S3 | 22.53 |
| Daily Pivot Point R1 | 23.95 |
| Daily Pivot Point R2 | 24.33 |
| Daily Pivot Point R3 | 24.66 |
[/s2If]
Join Our Telegram Group
")


