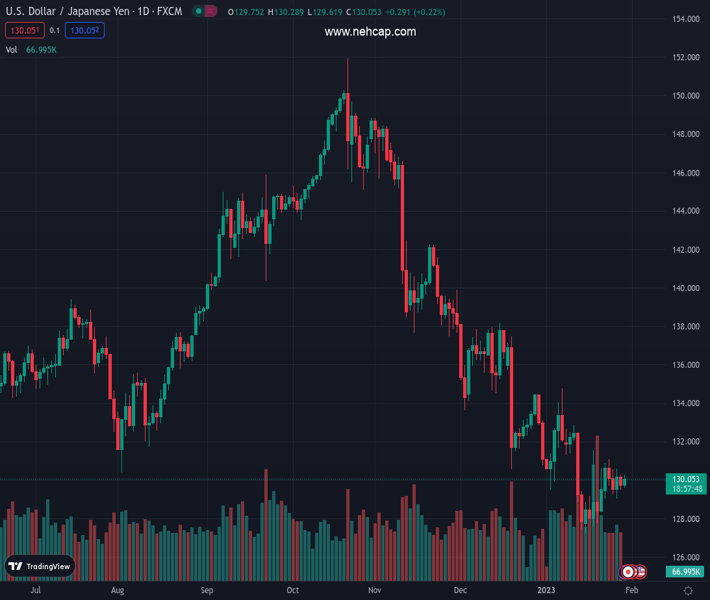
#USDJPY @ 130.052 grinds higher around intraday top after two-week rebound from multi-month low., @nehcap view: Further upside expected (Pivot Orderbook analysis)
…
This is a premium post.
[s2If !current_user_can(access_s2member_level4)]Please register for PREMIUM VERSION HERE to read full post below containing analysis. In case of any error or you think you are not able to read the full post below, please email us at support#nehcap.com [lwa][/s2If] [s2If current_user_can(access_s2member_level4)]
- USD/JPY grinds higher around intraday top after two-week rebound from multi-month low.
- Convergence of 21-DMA, downward-sloping trend line from late November guards immediate upside.
- Bullish MACD signals, firmer RSI (14) adds strength to the bullish bias.
- Bears need validation from fortnight-old ascending trend line to retake control.
The pair currently trades last at 130.052.
The previous day high was 130.28 while the previous day low was 129.5. The daily 38.2% Fib levels comes at 129.8, expected to provide support. Similarly, the daily 61.8% fib level is at 129.98, expected to provide support.
USD/JPY prints mild gains as buyers muster the courage to overcome the key 130.40 resistance confluence during early Monday morning, close to 130.10 by the press time.
In doing so, the Yen pair defends the two-week rebound from the lowest levels since May 2022 while staying above a fortnight-old ascending trend line.
Additionally favoring the USD/JPY buyers are the bullish MACD signals and the firmer RSI (14), not overbought.
However, a convergence of the 21-DMA and a two-month-long downward-sloping resistance line, around 130.40, appears a tough nut to crack for the pair buyers.
Following that, a run-up towards refreshing the monthly high near 134.80 can’t be ruled out.
During the anticipated rise past 130.40, the 131.00 round figure and January 18 high near 131.60 might probe the USD/JPY bulls.
On the contrary, a downside break of the aforementioned nearby support line, close to 129.40, could recall the USD/JPY bears targeting the monthly low of 127.20.
In a case where the USD/JPY sellers keep the reins past 127.20, the May 2022 low near 126.35 will be in focus.
Overall, USD/JPY bears appear to run out of steam but the buyers need validation from 130.40.
Trend: Further upside expected
Technical Levels: Supports and Resistances
USDJPY currently trading at 130.13 at the time of writing. Pair opened at 129.88 and is trading with a change of 0.19% % .
| Overview | Overview.1 | |
|---|---|---|
| 0 | Today last price | 130.13 |
| 1 | Today Daily Change | 0.25 |
| 2 | Today Daily Change % | 0.19% |
| 3 | Today daily open | 129.88 |
The pair remains strongly bearish on the daily time frame. It trades below the 20 SMA @ 130.38, 50 SMA 133.83, 100 SMA @ 139.46 and 200 SMA @ 136.76.
| Trends | Trends.1 | |
|---|---|---|
| 0 | Daily SMA20 | 130.38 |
| 1 | Daily SMA50 | 133.83 |
| 2 | Daily SMA100 | 139.46 |
| 3 | Daily SMA200 | 136.76 |
The previous day high was 130.28 while the previous day low was 129.5. The daily 38.2% Fib levels comes at 129.8, expected to provide support. Similarly, the daily 61.8% fib level is at 129.98, expected to provide support.
Note the levels of interest below:
- Pivot support is noted at 129.49, 129.11, 128.71
- Pivot resistance is noted at 130.27, 130.67, 131.05
| Levels | Levels.1 |
|---|---|
| Previous Daily High | 130.28 |
| Previous Daily Low | 129.50 |
| Previous Weekly High | 131.12 |
| Previous Weekly Low | 129.02 |
| Previous Monthly High | 138.18 |
| Previous Monthly Low | 130.57 |
| Daily Fibonacci 38.2% | 129.80 |
| Daily Fibonacci 61.8% | 129.98 |
| Daily Pivot Point S1 | 129.49 |
| Daily Pivot Point S2 | 129.11 |
| Daily Pivot Point S3 | 128.71 |
| Daily Pivot Point R1 | 130.27 |
| Daily Pivot Point R2 | 130.67 |
| Daily Pivot Point R3 | 131.05 |
[/s2If]
Join Our Telegram Group
")


