Chinese stocks are accelerating after the Lunar New Year holidays as optimism about economic recovery deepens. (Pivot Orderbook analysis)
…
This is a premium post.
[s2If !current_user_can(access_s2member_level4)]Please register for PREMIUM VERSION HERE to read full post below containing analysis. In case of any error or you think you are not able to read the full post below, please email us at support#nehcap.com [lwa][/s2If] [s2If current_user_can(access_s2member_level4)]
- Chinese stocks are accelerating after the Lunar New Year holidays as optimism about economic recovery deepens.
- BOJ Kuroda is confident about keeping the 2% inflation target due to rising wages.
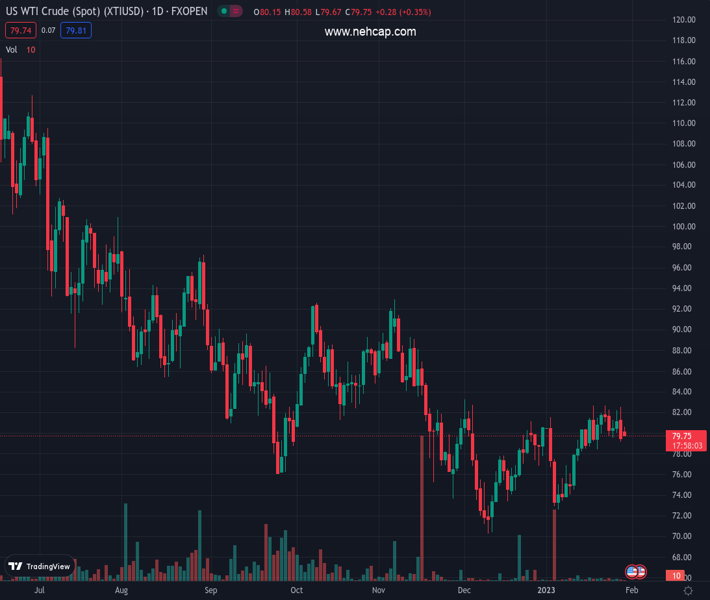
- The oil price has resumed its downside journey as Russia has increased the oil supply.
The pair currently trades last at 27470.8.
The previous day high was 27524.88 while the previous day low was 27328.5. The daily 38.2% Fib levels comes at 27449.86, expected to provide support. Similarly, the daily 61.8% fib level is at 27403.52, expected to provide support.
Markets in the Asian domain are showing an expression of strength despite cautious market sentiment. Chinese stocks are showing resilience after the Lunar New Year holidays while Japanese equities are displaying marginal gains. S&P500 futures have surrendered their entire gains recorded on Friday as investors have turned risk-averse amid Federal Reserve (Fed)’s policy-inspired volatility, which is scheduled this week.
At the press time, Japan’s Nikkei225 added 0.20%, China A50 soared 1.60%, Hang Seng tumbled 1.06%, and KOSPI plunged 1.24%.
The US Dollar Index is struggling to extend gains after recovery from 101.50 despite the risk-off market mood. The upside in the USD Index is capped around 101.80 from the last week as Fed chair Jerome Powell is set to hike interest rates with a smaller rate. Inflationary pressures in the United States have trimmed significantly, which has provided some room for the Fed to announce a modest rate hike.
Chinese stocks have soared dramatically amid optimism boosted by commentary from China’s cabinet that said on Saturday “It would promote a consumption recovery as the major driver of the economy and boost imports”, state broadcaster CCTV reported per Reuters. The news highlights the cooling of global demand and recession concerns behind the readiness of China policymakers to act.
Meanwhile, Japanese indices are collecting strength as Bank of Japan (BoJ) Governor Haruhiko Kuroda is expecting that the economy can achieve a 2% inflation target through rising wages. The continuation of easy monetary policy creates a condition that allows firms to hike wages. This might result in a bumper demand from individuals, which would keep inflation nearby the desired targets.
On the oil front oil price has resumed its downside journey after a pullback move. Downside bias in the oil price emerged after Reuters reported that Russia’s oil loadings from its Baltic ports were set to rise by 50% in January from December levels in order to address the strong demand coming from Asia. Russian oil supply is accelerating despite the sanctions by the Western cartel.
Technical Levels: Supports and Resistances
XTIUSD currently trading at 27470.8 at the time of writing. Pair opened at 27470.58 and is trading with a change of 0.0 % .
| Overview | Overview.1 | |
|---|---|---|
| 0 | Today last price | 27470.80 |
| 1 | Today Daily Change | 0.00 |
| 2 | Today Daily Change % | 0.00 |
| 3 | Today daily open | 27470.58 |
The pair remains strongly bullish on the daily timeframe. It trades above its 20 SMA @ 26478.41, 50 SMA 27051.33, 100 SMA @ 27179.08 and 200 SMA @ 27214.86.
| Trends | Trends.1 | |
|---|---|---|
| 0 | Daily SMA20 | 26478.41 |
| 1 | Daily SMA50 | 27051.33 |
| 2 | Daily SMA100 | 27179.08 |
| 3 | Daily SMA200 | 27214.86 |
The previous day high was 27524.88 while the previous day low was 27328.5. The daily 38.2% Fib levels comes at 27449.86, expected to provide support. Similarly, the daily 61.8% fib level is at 27403.52, expected to provide support.
Note the levels of interest below:
- Pivot support is noted at 27357.76, 27244.94, 27161.38
- Pivot resistance is noted at 27554.14, 27637.7, 27750.52
| Levels | Levels.1 |
|---|---|
| Previous Daily High | 27524.88 |
| Previous Daily Low | 27328.50 |
| Previous Weekly High | 27561.03 |
| Previous Weekly Low | 26928.22 |
| Previous Monthly High | 28325.89 |
| Previous Monthly Low | 25793.22 |
| Daily Fibonacci 38.2% | 27449.86 |
| Daily Fibonacci 61.8% | 27403.52 |
| Daily Pivot Point S1 | 27357.76 |
| Daily Pivot Point S2 | 27244.94 |
| Daily Pivot Point S3 | 27161.38 |
| Daily Pivot Point R1 | 27554.14 |
| Daily Pivot Point R2 | 27637.70 |
| Daily Pivot Point R3 | 27750.52 |
[/s2If]
Join Our Telegram Group
")


