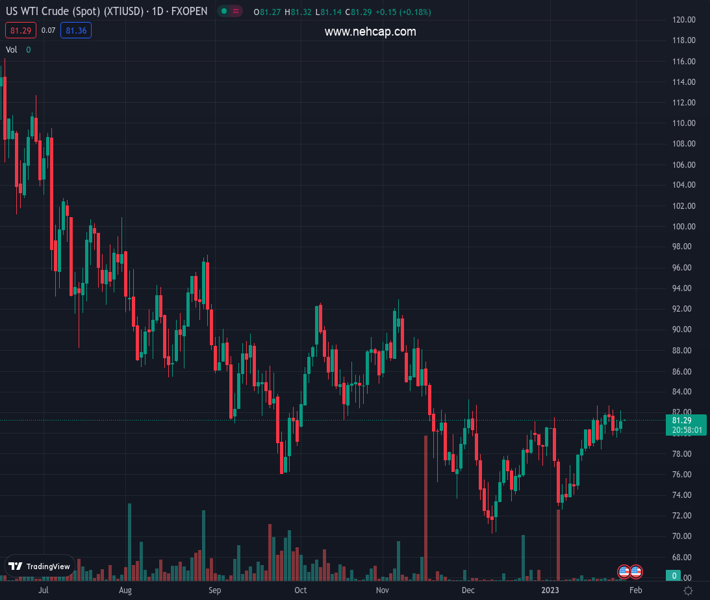
WTI clings to mild gains after two-day uptrend, braces for first weekly loss in three. (Pivot Orderbook analysis)
…
This is a premium post.
[s2If !current_user_can(access_s2member_level4)]Please register for PREMIUM VERSION HERE to read full post below containing analysis. In case of any error or you think you are not able to read the full post below, please email us at support#nehcap.com [lwa][/s2If] [s2If current_user_can(access_s2member_level4)]
- WTI clings to mild gains after two-day uptrend, braces for first weekly loss in three.
- Upbeat US growth numbers, likely inaction from OPEC+ and China reopening underpin bullish bias.
- Mixed details of US GDP, cautious mood ahead of Fed’s preferred inflation gauge probe Oil buyers.
The pair currently trades last at 81.26.
The previous day high was 82.21 while the previous day low was 80.02. The daily 38.2% Fib levels comes at 81.37, expected to provide resistance. Similarly, the daily 61.8% fib level is at 80.85, expected to provide support.
WTI crude oil price print mild gains as bulls and bears jostle around $81.30 during the third positive day on Friday morning. In doing so, the black gold portrays the market’s cautious optimism surrounding the future energy demand, as well as cheers the US Dollar weakness, while waiting for fresh clues.
That said, the US Dollar Index (DXY) retreats to 101.80, following a corrective bounce off an eight-month low backed by overall upbeat US economics. On Thursday, the US Bureau of Economic Analysis (BEA) released the first estimate of the US fourth quarter (Q4) Gross Domestic Product that marked an annualized growth rate of 2.9% versus 2.6% expected and 3.2% prior. On the same line, the Durable Goods Orders jumped 5.6% in December versus 2.5% market forecast and -1.7% upwardly revised prior. It should be noted, however, that the growth of Personal Consumption Expenditures Prices weakened to 3.2% QoQ in Q4 compared to 4.3% marked forecast and prior readings. Further, Core Personal Consumption Expenditures eased to 3.9% QoQ for the Q4 from 4.7% previous readings, versus 5.3% expected.
On the other hand, chatters surrounding a jump in China’s festive demand, backed by a report from Bloomberg, also increase the hopes of the higher future demand from the US and China, the world’s top two economies.
It’s worth noting that the talks surrounding the Organization of the Petroleum Exporting Countries (OPEC) and their allies, including Russia, collectively known as OPEC+, also favor the Oil buyers. “The OPEC+ ministerial panel meeting on Feb. 1 is likely to endorse the oil producer group’s current output levels, OPEC+ sources said,” reported Reuters.
Alternatively, Reuters poll of global economists raise doubts on the cautious optimism and renew recession woes, which in turn probe the WTI crude oil buyers. On the same line could be the hawkish concerns surrounding the European Central Bank (ECB) and Bank of Japan (BoJ), as well as expected rate hike from the US Federal Reserve (Fed).
Moving on, the Oil traders will pay close attention to the Fed’s preferred inflation gauge, namely Core Personal Consumption Expenditures (PCE) – Price Index for December, expected to remain unchanged at 0.2% MoM, for clear directions. Should the inflation precursor surprises the market, mainly by declining, the WTI may have further upside to track as it will weigh on the odds favoring the Fed’s aggressive rate hikes.
Repeated failures to cross the 100-DMA around $81.65 by the press time, teases WTI crude oil sellers.
Technical Levels: Supports and Resistances
XTIUSD currently trading at 81.26 at the time of writing. Pair opened at 81.19 and is trading with a change of 0.09% % .
| Overview | Overview.1 | |
|---|---|---|
| 0 | Today last price | 81.26 |
| 1 | Today Daily Change | 0.07 |
| 2 | Today Daily Change % | 0.09% |
| 3 | Today daily open | 81.19 |
The pair is trading above its 20 Daily moving average @ 78.62, above its 50 Daily moving average @ 77.85 , below its 100 Daily moving average @ 81.68 and below its 200 Daily moving average @ 91.51
| Trends | Trends.1 | |
|---|---|---|
| 0 | Daily SMA20 | 78.62 |
| 1 | Daily SMA50 | 77.85 |
| 2 | Daily SMA100 | 81.68 |
| 3 | Daily SMA200 | 91.51 |
The previous day high was 82.21 while the previous day low was 80.02. The daily 38.2% Fib levels comes at 81.37, expected to provide resistance. Similarly, the daily 61.8% fib level is at 80.85, expected to provide support.
Note the levels of interest below:
- Pivot support is noted at 80.06, 78.94, 77.87
- Pivot resistance is noted at 82.26, 83.33, 84.45
| Levels | Levels.1 |
|---|---|
| Previous Daily High | 82.21 |
| Previous Daily Low | 80.02 |
| Previous Weekly High | 82.67 |
| Previous Weekly Low | 78.48 |
| Previous Monthly High | 83.30 |
| Previous Monthly Low | 70.27 |
| Daily Fibonacci 38.2% | 81.37 |
| Daily Fibonacci 61.8% | 80.85 |
| Daily Pivot Point S1 | 80.06 |
| Daily Pivot Point S2 | 78.94 |
| Daily Pivot Point S3 | 77.87 |
| Daily Pivot Point R1 | 82.26 |
| Daily Pivot Point R2 | 83.33 |
| Daily Pivot Point R3 | 84.45 |
[/s2If]
Join Our Telegram Group
")


