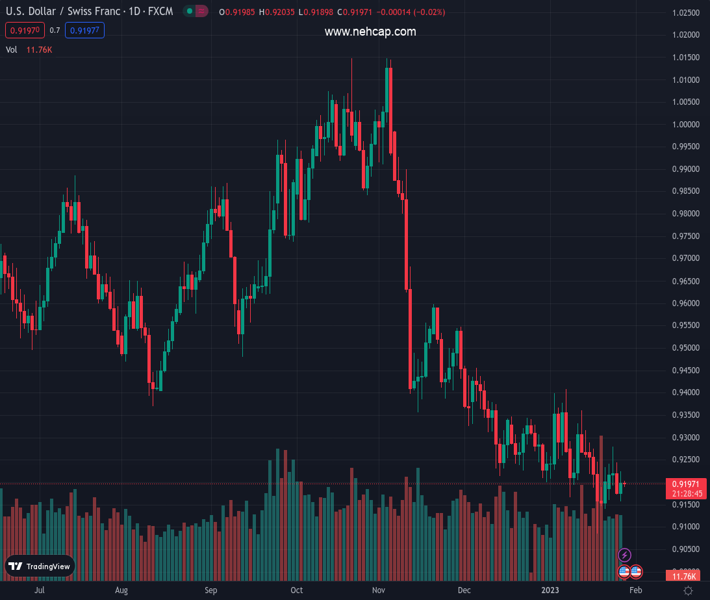
#USDCHF @ 0.91985 is struggling to surpass the 0.9200 resistance despite a decline in investors’ risk appetite. (Pivot Orderbook analysis)
…
This is a premium post.
[s2If !current_user_can(access_s2member_level4)]Please register for PREMIUM VERSION HERE to read full post below containing analysis. In case of any error or you think you are not able to read the full post below, please email us at support#nehcap.com [lwa][/s2If] [s2If current_user_can(access_s2member_level4)]
- USD/CHF is struggling to surpass the 0.9200 resistance despite a decline in investors’ risk appetite.
- The USD Index is expected to stay offered in a 101.30-102.00 range ahead of the Fed’s policy.
- Swiss Real Retail Sales are expected to expand by 2.6% vs. -1.3% recorded earlier.
The pair currently trades last at 0.91985.
The previous day high was 0.9245 while the previous day low was 0.9172. The daily 38.2% Fib levels comes at 0.92, expected to provide resistance. Similarly, the daily 61.8% fib level is at 0.9217, expected to provide resistance.
The USD/CHF pair is sensing hurdles in scaling above the immediate resistance of 0.9200 in the early Asian session. The Swiss Franc asset is attempting to build a base around 0.9200 for a subtle rebound as investors are getting anxious ahead of the release of the United States Personal Consumption Expenditure (PCE) Price Index data.
The risk appetite of the market participants has trimmed as the S&P500 futures are displaying some losses in early Asia. Optimism built from the strength shown by the 500-US stock basket on Thursday is fading now. The US Dollar Index (DXY) might look for a recovery move after dropping to near 101.40. Meanwhile, the 10-year US Treasury yields have climbed above 3.50% as investors are shifting their focus broadly towards the interest rate decision by the Federal Reserve (Fed), which is scheduled for next week.
On Friday, investors might witness a power-pack action after the release of the Fed’s preferred inflation tool. The monthly core PCE price index (Dec) is seen as unchanged at 0.2%. Apart from that Michigan Consumer Sentiment Index will remain in focus, which is also seen steady at 64.6.
Next week, the event of the monetary policy announcement by Fed chair Jerome Powell will keep the USD index in traction. In the opinion of economists at ING, US Dollar could go into next week’s Fed meeting on the offered side.” They further added that “We are not sure that DXY is ready to break below support at 101.30 just yet. And we see next week’s FOMC meeting as an upside risk to the Dollar. But for the time being, expect DXY to stay offered in a 101.30-102.00 range.”
On the Swiss Franc front, investors will focus on next week’s Real Retail Sales data. As per the consensus, the economic data is seen at 2.6% vs. a contraction of 1.3% reported earlier. An upbeat retail demand could trigger inflation projections. The Swiss National Bank (SNB) is still looking for a strong footing for economic recovery.
Technical Levels: Supports and Resistances
USDCHF currently trading at 0.9198 at the time of writing. Pair opened at 0.9181 and is trading with a change of 0.19 % .
| Overview | Overview.1 | |
|---|---|---|
| 0 | Today last price | 0.9198 |
| 1 | Today Daily Change | 0.0017 |
| 2 | Today Daily Change % | 0.1900 |
| 3 | Today daily open | 0.9181 |
The pair remains strongly bearish on the daily time frame. It trades below the 20 SMA @ 0.9248, 50 SMA 0.9331, 100 SMA @ 0.9578 and 200 SMA @ 0.9635.
| Trends | Trends.1 | |
|---|---|---|
| 0 | Daily SMA20 | 0.9248 |
| 1 | Daily SMA50 | 0.9331 |
| 2 | Daily SMA100 | 0.9578 |
| 3 | Daily SMA200 | 0.9635 |
The previous day high was 0.9245 while the previous day low was 0.9172. The daily 38.2% Fib levels comes at 0.92, expected to provide resistance. Similarly, the daily 61.8% fib level is at 0.9217, expected to provide resistance.
Note the levels of interest below:
- Pivot support is noted at 0.9154, 0.9126, 0.908
- Pivot resistance is noted at 0.9226, 0.9272, 0.93
| Levels | Levels.1 |
|---|---|
| Previous Daily High | 0.9245 |
| Previous Daily Low | 0.9172 |
| Previous Weekly High | 0.9288 |
| Previous Weekly Low | 0.9085 |
| Previous Monthly High | 0.9471 |
| Previous Monthly Low | 0.9201 |
| Daily Fibonacci 38.2% | 0.9200 |
| Daily Fibonacci 61.8% | 0.9217 |
| Daily Pivot Point S1 | 0.9154 |
| Daily Pivot Point S2 | 0.9126 |
| Daily Pivot Point S3 | 0.9080 |
| Daily Pivot Point R1 | 0.9226 |
| Daily Pivot Point R2 | 0.9272 |
| Daily Pivot Point R3 | 0.9300 |
[/s2If]
Join Our Telegram Group
")


