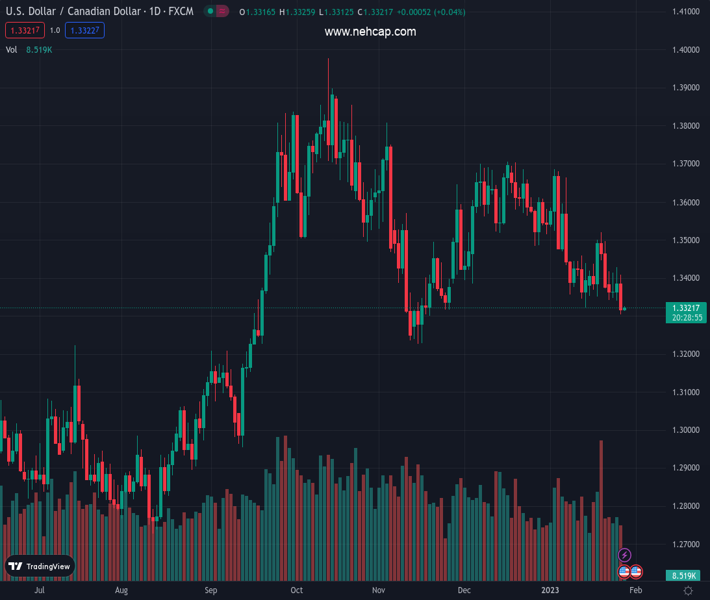
#USDCAD @ 1.33220 remains pressured around 10-week low, down for the second consecutive day. (Pivot Orderbook analysis)
…
This is a premium post.
[s2If !current_user_can(access_s2member_level4)]Please register for PREMIUM VERSION HERE to read full post below containing analysis. In case of any error or you think you are not able to read the full post below, please email us at support#nehcap.com [lwa][/s2If] [s2If current_user_can(access_s2member_level4)]
- USD/CAD remains pressured around 10-week low, down for the second consecutive day.
- US Dollar fades post-GDP rebound amid mixed details.
- Oil price stays firmer in hopes of more energy demand, softer USD.
- Cautious mood ahead of US Core PCE Price Index for December probes Loonie pair traders.
The pair currently trades last at 1.33220.
The previous day high was 1.3408 while the previous day low was 1.3303. The daily 38.2% Fib levels comes at 1.3343, expected to provide resistance. Similarly, the daily 61.8% fib level is at 1.3368, expected to provide resistance.
USD/CAD takes offers to refresh the intraday low near 1.3315 while keeping the previous day’s south-run to a 2.5-month low during early Friday. In doing so, the Loonie pair cheers broad US Dollar weakness, as well as firmer prices of Canada’s main export item WTI crude oil, ahead of the key US data.
US Dollar Index (DXY) retreats to 101.70, following a corrective bounce off an eight-month low backed by overall upbeat US economics.
On Thursday, the US Bureau of Economic Analysis (BEA) released the first estimate of the US fourth quarter (Q4) Gross Domestic Product that marked an annualized growth rate of 2.9% versus 2.6% expected and 3.2% prior. On the same line, the Durable Goods Orders jumped 5.6% in December versus 2.5% market forecast and -1.7% upwardly revised prior.
It should be noted, however, that the growth of Personal Consumption Expenditures Prices weakened to 3.2% QoQ in Q4 compared to 4.3% marked forecast and prior readings. Further, Core Personal Consumption Expenditures (PCE) eased to 3.9% QoQ for Q4 from 4.7% previous readings, versus 5.3% expected. As a result, the mixed details of the US data teased DXY bears after an initial favor.
Elsewhere, WTI crude oil remains mildly bid during the three-day winning streak, near $81.35 by the press time, as a softer US Dollar joins hopes of more energy demand from the US and China. Also keeping the commodity buyers hopeful are the expectations of no change in the output cut policy of the Organization of the Petroleum Exporting Countries (OPEC) and their allies, including Russia, collectively known as OPEC+, up for a meeting on February 01.
Amid these plays, the US Treasury bond yields remain firmer but the S&P 500 Futures print mild losses despite the upbeat closing of Wall Street.
Looking ahead, the USD/CAD bear’s dominance depends upon the US Core PCE – Price Index for December, expected to remain unchanged at 0.2% MoM, as the Fed’s dovish hike is almost priced-in.
A clear downside break of the 2.5-month-old ascending support line, now resistance around 1.3345, directs USD/CAD towards November 2022 low near 1.3225.
Technical Levels: Supports and Resistances
USDCAD currently trading at 1.3316 at the time of writing. Pair opened at 1.3324 and is trading with a change of -0.06 % .
| Overview | Overview.1 | |
|---|---|---|
| 0 | Today last price | 1.3316 |
| 1 | Today Daily Change | -0.0008 |
| 2 | Today Daily Change % | -0.0600 |
| 3 | Today daily open | 1.3324 |
The pair is trading below its 20 Daily moving average @ 1.3445, below its 50 Daily moving average @ 1.3504 , below its 100 Daily moving average @ 1.3522 and above its 200 Daily moving average @ 1.3205
| Trends | Trends.1 | |
|---|---|---|
| 0 | Daily SMA20 | 1.3445 |
| 1 | Daily SMA50 | 1.3504 |
| 2 | Daily SMA100 | 1.3522 |
| 3 | Daily SMA200 | 1.3205 |
The previous day high was 1.3408 while the previous day low was 1.3303. The daily 38.2% Fib levels comes at 1.3343, expected to provide resistance. Similarly, the daily 61.8% fib level is at 1.3368, expected to provide resistance.
Note the levels of interest below:
- Pivot support is noted at 1.3282, 1.324, 1.3178
- Pivot resistance is noted at 1.3387, 1.345, 1.3492
| Levels | Levels.1 |
|---|---|
| Previous Daily High | 1.3408 |
| Previous Daily Low | 1.3303 |
| Previous Weekly High | 1.3521 |
| Previous Weekly Low | 1.3351 |
| Previous Monthly High | 1.3705 |
| Previous Monthly Low | 1.3385 |
| Daily Fibonacci 38.2% | 1.3343 |
| Daily Fibonacci 61.8% | 1.3368 |
| Daily Pivot Point S1 | 1.3282 |
| Daily Pivot Point S2 | 1.3240 |
| Daily Pivot Point S3 | 1.3178 |
| Daily Pivot Point R1 | 1.3387 |
| Daily Pivot Point R2 | 1.3450 |
| Daily Pivot Point R3 | 1.3492 |
[/s2If]
Join Our Telegram Group
")


