#NZDUSD @ 0.64975 bulls move in to test mid-week highs. (Pivot Orderbook analysis)
…
This is a premium post.
[s2If !current_user_can(access_s2member_level4)]Please register for PREMIUM VERSION HERE to read full post below containing analysis. In case of any error or you think you are not able to read the full post below, please email us at support#nehcap.com [lwa][/s2If] [s2If current_user_can(access_s2member_level4)]
- NZD/USD bulls move in to test mid-week highs.
- US red news on the calendar will be key for the pair to end the week.
The pair currently trades last at 0.64975.
The previous day high was 0.6515 while the previous day low was 0.6457. The daily 38.2% Fib levels comes at 0.6493, expected to provide support. Similarly, the daily 61.8% fib level is at 0.6479, expected to provide support.
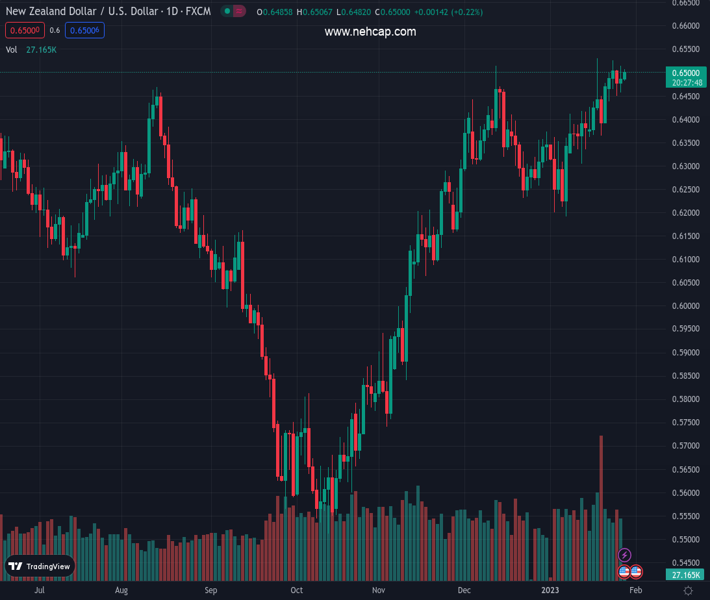
NZD/USD is currently trading at 0.6500 and is 0.3% higher at the start of Friday with the bird taking flight on a softer US Dollar ahead of key data for the US session ahead. The pair has rallied from a low of 0.6482 to a high of 0.6506 so far, reaching the highs of Wednesday with the multi-month highs in sight that were made following New Zealand’s Consumer Inflation data that held near three-decade highs in the fourth quarter.
New Zealand’s annual inflation stood at 7.2% in the December quarter, higher than market expectations for a 7.1% rise but below the Reserve Bank of New Zealand’s forecast of 7.5% Nevertheless, this was bolstering expectations of less aggressive interest rate hikes in the coming months. There is sentiment for only a 50 basis point rate hike in February after delivering a record 75 basis point increase in November.
Meanwhile, the focus is back on the Federal reserve which will make its interest rate decision on February 1. On Thursday, the US Gross Domestic Product data reading was strong and this will give the members of the Federal Open Market Committee plenty to consider as it enters its policy discussions next week. The advanced Q4 GDP came in slightly stronger than expected at 2.9% vs 3.2% in Q3.
Analysts at ANZ Bank said that the upcoming personal income, expenditure and deflator data (due out tonight) is arguably more important. ”Consensus expects a 0.1% decline in real personal spending. That would be the first decline in 12 months and the first fall that was not driven by COVID-19 restrictions for quite a few years,” the analysts argued. ”The core deflator is forecast at 0.3% MoM with annual inflation at 4.4% YoY. That would be the lowest print since October 2021, and while still too high would sit well with the idea of the FOMC entering a more considered phase of the tightening cycle.”
Looking ahead, the New Zealand fourth quarter labour market data (out next week) where the wages will be monitored. Analysts at ANZ Bank said that the RBNZ will have a little more scope to dial back the pace of OCR hikes if these wage spirals were to cool as the central bank feels out an appropriate level for the OCR where the MPC can comfortably “watch, worry and wait”. ”We think that speaks to a 50bp hike in February, and a peak of 5.25%.”
Technical Levels: Supports and Resistances
NZDUSD currently trading at 0.6505 at the time of writing. Pair opened at 0.6492 and is trading with a change of 0.2 % .
| Overview | Overview.1 | |
|---|---|---|
| 0 | Today last price | 0.6505 |
| 1 | Today Daily Change | 0.0013 |
| 2 | Today Daily Change % | 0.2000 |
| 3 | Today daily open | 0.6492 |
The pair remains strongly bullish on the daily timeframe. It trades above its 20 SMA @ 0.6388, 50 SMA 0.6339, 100 SMA @ 0.6081 and 200 SMA @ 0.6195.
| Trends | Trends.1 | |
|---|---|---|
| 0 | Daily SMA20 | 0.6388 |
| 1 | Daily SMA50 | 0.6339 |
| 2 | Daily SMA100 | 0.6081 |
| 3 | Daily SMA200 | 0.6195 |
The previous day high was 0.6515 while the previous day low was 0.6457. The daily 38.2% Fib levels comes at 0.6493, expected to provide support. Similarly, the daily 61.8% fib level is at 0.6479, expected to provide support.
Note the levels of interest below:
- Pivot support is noted at 0.6461, 0.643, 0.6404
- Pivot resistance is noted at 0.6519, 0.6545, 0.6576
| Levels | Levels.1 |
|---|---|
| Previous Daily High | 0.6515 |
| Previous Daily Low | 0.6457 |
| Previous Weekly High | 0.6531 |
| Previous Weekly Low | 0.6361 |
| Previous Monthly High | 0.6514 |
| Previous Monthly Low | 0.6230 |
| Daily Fibonacci 38.2% | 0.6493 |
| Daily Fibonacci 61.8% | 0.6479 |
| Daily Pivot Point S1 | 0.6461 |
| Daily Pivot Point S2 | 0.6430 |
| Daily Pivot Point S3 | 0.6404 |
| Daily Pivot Point R1 | 0.6519 |
| Daily Pivot Point R2 | 0.6545 |
| Daily Pivot Point R3 | 0.6576 |
[/s2If]
Join Our Telegram Group
")


