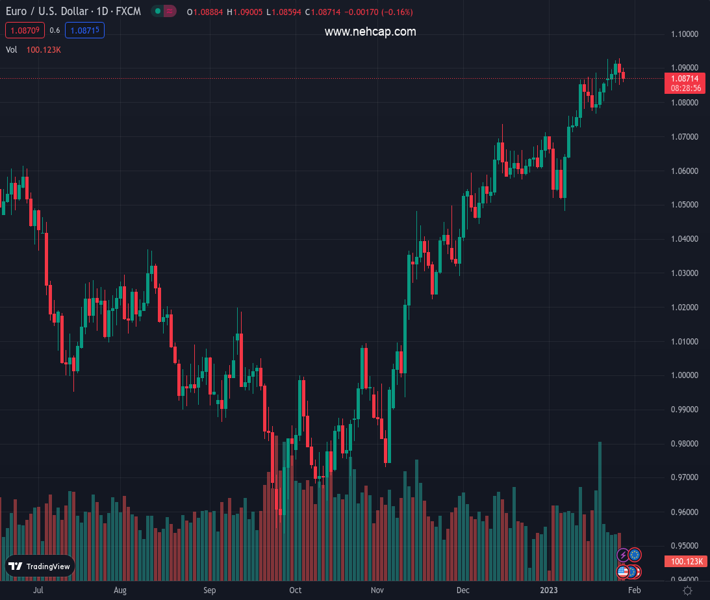
#EURUSD @ 1.08726 faces a corrective decline and drops to 1.0860. (Pivot Orderbook analysis)
…
This is a premium post.
[s2If !current_user_can(access_s2member_level4)]Please register for PREMIUM VERSION HERE to read full post below containing analysis. In case of any error or you think you are not able to read the full post below, please email us at support#nehcap.com [lwa][/s2If] [s2If current_user_can(access_s2member_level4)]
- EUR/USD faces a corrective decline and drops to 1.0860.
- The short-term bullish bias remains unchanged above 1.0690.
The pair currently trades last at 1.08726.
The previous day high was 1.093 while the previous day low was 1.085. The daily 38.2% Fib levels comes at 1.0881, expected to provide resistance. Similarly, the daily 61.8% fib level is at 1.0899, expected to provide resistance.
EUR/USD retreats for the second session in a row and revisits the 1.0860 region on Friday.
While above the short-term support line around 1.0690, extra gains should remain in store for the pair.
Indeed, the continuation of the uptrend now needs to rapidly clear the 2023 high at 1.0929 (January 26) to allow for a test of the weekly top at 1.0936 (April 21 2022). A sustainable break above this level could pave the way for a challenge of the key barrier at 1.1000 the figure sooner rather than later.
In the longer run, the constructive view remains unchanged while above the 200-day SMA, today at 1.0309.
Technical Levels: Supports and Resistances
EURUSD currently trading at 1.0865 at the time of writing. Pair opened at 1.0892 and is trading with a change of -0.25 % .
| Overview | Overview.1 | |
|---|---|---|
| 0 | Today last price | 1.0865 |
| 1 | Today Daily Change | 41.0000 |
| 2 | Today Daily Change % | -0.2500 |
| 3 | Today daily open | 1.0892 |
The pair remains strongly bullish on the daily timeframe. It trades above its 20 SMA @ 1.0762, 50 SMA 1.0613, 100 SMA @ 1.0269 and 200 SMA @ 1.0311.
| Trends | Trends.1 | |
|---|---|---|
| 0 | Daily SMA20 | 1.0762 |
| 1 | Daily SMA50 | 1.0613 |
| 2 | Daily SMA100 | 1.0269 |
| 3 | Daily SMA200 | 1.0311 |
The previous day high was 1.093 while the previous day low was 1.085. The daily 38.2% Fib levels comes at 1.0881, expected to provide resistance. Similarly, the daily 61.8% fib level is at 1.0899, expected to provide resistance.
Note the levels of interest below:
- Pivot support is noted at 1.0852, 1.0812, 1.0773
- Pivot resistance is noted at 1.0931, 1.097, 1.101
| Levels | Levels.1 |
|---|---|
| Previous Daily High | 1.0930 |
| Previous Daily Low | 1.0850 |
| Previous Weekly High | 1.0888 |
| Previous Weekly Low | 1.0766 |
| Previous Monthly High | 1.0736 |
| Previous Monthly Low | 1.0393 |
| Daily Fibonacci 38.2% | 1.0881 |
| Daily Fibonacci 61.8% | 1.0899 |
| Daily Pivot Point S1 | 1.0852 |
| Daily Pivot Point S2 | 1.0812 |
| Daily Pivot Point S3 | 1.0773 |
| Daily Pivot Point R1 | 1.0931 |
| Daily Pivot Point R2 | 1.0970 |
| Daily Pivot Point R3 | 1.1010 |
[/s2If]
Join Our Telegram Group
")


