Asian Stock Market: Trades flat amid Fed’s interest rate buzz, USD Index recovers, oil consolidates (Pivot Orderbook analysis)
…
This is a premium post.
[s2If !current_user_can(access_s2member_level4)]Please register for PREMIUM VERSION HERE to read full post below containing analysis. In case of any error or you think you are not able to read the full post below, please email us at support#nehcap.com [lwa][/s2If] [s2If current_user_can(access_s2member_level4)]
The pair currently trades last at 27546.04.
The previous day high was 27561.03 while the previous day low was 27373.97. The daily 38.2% Fib levels comes at 27489.57, expected to provide support. Similarly, the daily 61.8% fib level is at 27445.43, expected to provide support.
Markets in the Asian domain are displaying a lackluster perfromance as investors are awaiting fresh development for Federal Reserve (Fed)’s interest rate discussions for further action. S&P500 futures have surrendered one-third of its gains recorded in Thursday’s session as investors have turned anxious ahead of the release of the United States Personal Consumption Expenditure (PCE) Price Index data, which is restricting the upside in the Asian equities. Meanwhile, the downside is being supported by upbeat US Gross Domestic Product (GDP) and Durable Goods Orders data.
At the press time, Japan’s Nikkei225 trades almost flat, Hang Seng eases 0.14%, Nifty50 surrenders 0.54%, KOSPI jumped almost 1%. Meanwhile, Chinese markets are closed on account of Lunar New Year festival.
The US Dollar Index (DXY) has recovered firmly after dropping to near 101.30 in the Asian session. Investors preferred to hide themselves behind safe-haven assets as the release of the US PCE Price Index is expected to trigger sheer volatility in global market. Talking about the monetary policy by the Fed next week, Fed chair Jerome Powell is expected to hike interest rates by 25 basis points (bps) to 4.50-4.75%.
Japanese stocks have failed to display a power-pack action despite the Tokyo’s inflation met estimates. The headline Consumer Price Index (CPI) landed at 4.4% in line with the projections. The core CPI that excludes oil and food prices released at 3.0% higher than the estimates of 2.8%. Meanwhile, Japanese Prime Minister (PM) Fumio Kishida said in an appearance on Friday that he acknowledged the Bank of Japan’s (BoJ) December policy decision was an operational tweak to enhance and sustain monetary easing effects smoothly.
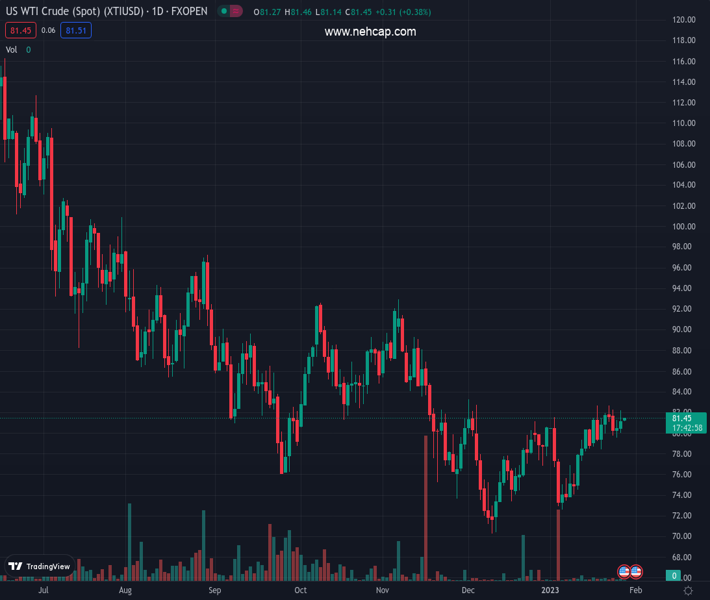
On the oil front, oil price is deomnstrating a lackluster performance as investors might take positions at full capacity after geeting outcome of the OPEC+ panel meeting. Reuters recently reported that the panel is unlikely to alter production levels, given that crude prices recovered sharply in early 2023, and that demand is forecast to surge as the Chinese economy recovers.
Technical Levels: Supports and Resistances
XTIUSD currently trading at 27546.04 at the time of writing. Pair opened at 27546.04 and is trading with a change of 0.0 % .
| Overview | Overview.1 | |
|---|---|---|
| 0 | Today last price | 27546.04 |
| 1 | Today Daily Change | 0.00 |
| 2 | Today Daily Change % | 0.00 |
| 3 | Today daily open | 27546.04 |
The pair remains strongly bullish on the daily timeframe. It trades above its 20 SMA @ 26399.55, 50 SMA 27061.57, 100 SMA @ 27188.67 and 200 SMA @ 27213.4.
| Trends | Trends.1 | |
|---|---|---|
| 0 | Daily SMA20 | 26399.55 |
| 1 | Daily SMA50 | 27061.57 |
| 2 | Daily SMA100 | 27188.67 |
| 3 | Daily SMA200 | 27213.40 |
The previous day high was 27561.03 while the previous day low was 27373.97. The daily 38.2% Fib levels comes at 27489.57, expected to provide support. Similarly, the daily 61.8% fib level is at 27445.43, expected to provide support.
Note the levels of interest below:
- Pivot support is noted at 27426.33, 27306.62, 27239.27
- Pivot resistance is noted at 27613.39, 27680.74, 27800.45
| Levels | Levels.1 |
|---|---|
| Previous Daily High | 27561.03 |
| Previous Daily Low | 27373.97 |
| Previous Weekly High | 26965.10 |
| Previous Weekly Low | 25812.13 |
| Previous Monthly High | 28325.89 |
| Previous Monthly Low | 25793.22 |
| Daily Fibonacci 38.2% | 27489.57 |
| Daily Fibonacci 61.8% | 27445.43 |
| Daily Pivot Point S1 | 27426.33 |
| Daily Pivot Point S2 | 27306.62 |
| Daily Pivot Point S3 | 27239.27 |
| Daily Pivot Point R1 | 27613.39 |
| Daily Pivot Point R2 | 27680.74 |
| Daily Pivot Point R3 | 27800.45 |
[/s2If]
Join Our Telegram Group
")


