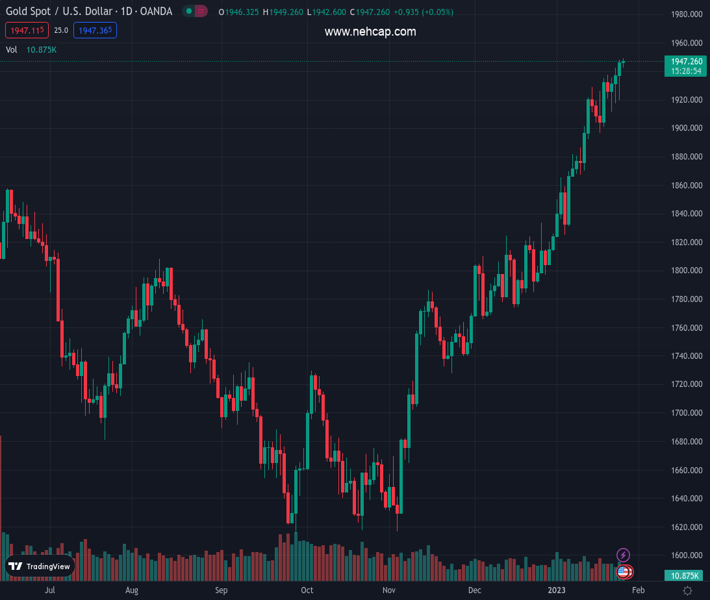
#XAUUSD @ 1,947.32 Gold price is struggling to test the $1,950.00 resistance as anxiety soars ahead of the US GDP. (Pivot Orderbook analysis)
…
This is a premium post.
[s2If !current_user_can(access_s2member_level4)]Please register for PREMIUM VERSION HERE to read full post below containing analysis. In case of any error or you think you are not able to read the full post below, please email us at support#nehcap.com [lwa][/s2If] [s2If current_user_can(access_s2member_level4)]
- Gold price is struggling to test the $1,950.00 resistance as anxiety soars ahead of the US GDP.
- The USD Index is building a cushion around 101.10 but could deliver a breakdown amid a risk-on mood.
- Rising odds of a smaller interest rate hike by the Fed are weighing down US yields.
The pair currently trades last at 1947.32.
The previous day high was 1948.17 while the previous day low was 1919.91. The daily 38.2% Fib levels comes at 1937.37, expected to provide support. Similarly, the daily 61.8% fib level is at 1930.71, expected to provide support.
Gold price (XAU/USD) has sensed selling pressure while attempting to kiss the critical resistance of $1,950.00. The precious metal is not getting the desired strength required to hit the $1,950.00 hurdle as investors are getting anxious ahead of the release of the United States Gross Domestic Product (GDP) and other critical economic data.
The US Dollar Index (DXY) is constantly grueling to build a cushion around 101.20 despite the upbeat market mood. S&P500 futures are displaying moderate gains, conveying the expression of the solid risk appetite of the market participants. The 10-year US Treasury yields have dropped to near 3.44%.
The street is continuously discussing the chances of a US recession in CY2023 as the Federal Reserve (Fed) has already tightened monetary policy significantly. The release of the US GDP data will provide more clarity about the scales of economic activities in the fourth quarter of CY2022. As per the projections, the US GDP is expected to contract to 2.6% from the former release of 3.2%. More-than-expected contraction in economic activities might bolster the case of a smaller interest rate hike by the Fed.
Gold price is forming a Bullish Flag chart pattern on an hourly scale, which indicates a continuation of the bullish momentum after the breakout of a consolidation. Usually, the consolidation phase of the chart pattern serves as an inventory adjustment in which those participants initiate longs, which prefer to enter an auction after the establishment of a bullish bias.
Advancing 20-and 50-period Exponential Moving Averages (EMAs) at $1,942.46 and $1,937.35 respectively add to the upside filters.
The Relative Strength Index (RSI) (14) is oscillating in a bullish range of 60.00-80.00, which indicates more upside ahead.
Technical Levels: Supports and Resistances
XAUUSD currently trading at 1948.61 at the time of writing. Pair opened at 1946.73 and is trading with a change of 0.1 % .
| Overview | Overview.1 | |
|---|---|---|
| 0 | Today last price | 1948.61 |
| 1 | Today Daily Change | 1.88 |
| 2 | Today Daily Change % | 0.10 |
| 3 | Today daily open | 1946.73 |
The pair remains strongly bullish on the daily timeframe. It trades above its 20 SMA @ 1885.23, 50 SMA 1822.32, 100 SMA @ 1750.98 and 200 SMA @ 1775.61.
| Trends | Trends.1 | |
|---|---|---|
| 0 | Daily SMA20 | 1885.23 |
| 1 | Daily SMA50 | 1822.32 |
| 2 | Daily SMA100 | 1750.98 |
| 3 | Daily SMA200 | 1775.61 |
The previous day high was 1948.17 while the previous day low was 1919.91. The daily 38.2% Fib levels comes at 1937.37, expected to provide support. Similarly, the daily 61.8% fib level is at 1930.71, expected to provide support.
Note the levels of interest below:
- Pivot support is noted at 1928.37, 1910.01, 1900.11
- Pivot resistance is noted at 1956.63, 1966.53, 1984.89
| Levels | Levels.1 |
|---|---|
| Previous Daily High | 1948.17 |
| Previous Daily Low | 1919.91 |
| Previous Weekly High | 1937.57 |
| Previous Weekly Low | 1896.63 |
| Previous Monthly High | 1833.38 |
| Previous Monthly Low | 1765.89 |
| Daily Fibonacci 38.2% | 1937.37 |
| Daily Fibonacci 61.8% | 1930.71 |
| Daily Pivot Point S1 | 1928.37 |
| Daily Pivot Point S2 | 1910.01 |
| Daily Pivot Point S3 | 1900.11 |
| Daily Pivot Point R1 | 1956.63 |
| Daily Pivot Point R2 | 1966.53 |
| Daily Pivot Point R3 | 1984.89 |
[/s2If]
Join Our Telegram Group
")


