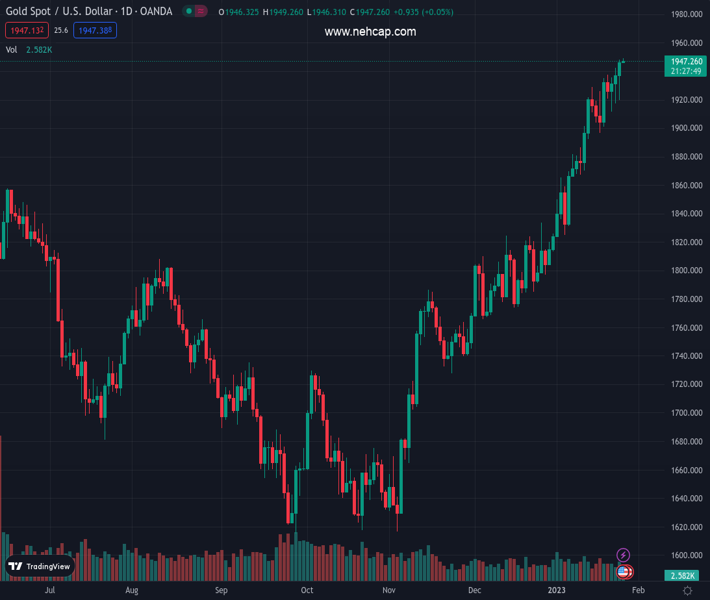
#XAUUSD @ 1,946.80 Gold price takes the bids to renew nine-month high, up for the fourth consecutive day., @nehcap view: Limited upside expected (Pivot Orderbook analysis)
…
This is a premium post.
[s2If !current_user_can(access_s2member_level4)]Please register for PREMIUM VERSION HERE to read full post below containing analysis. In case of any error or you think you are not able to read the full post below, please email us at support#nehcap.com [lwa][/s2If] [s2If current_user_can(access_s2member_level4)]
- Gold price takes the bids to renew nine-month high, up for the fourth consecutive day.
- US Dollar weakness underpins XAU/USD upside amid cautious mood ahead of the key United States Gross Domestic Product.
- Dovish bias surrounding the Fed contrasts with the hawkish outlook over ECB to weigh on USD and favor Gold buyers.
- Convergence of six-week-old ascending trend line, March 2022 peak could test XAU/USD bulls.
The pair currently trades last at 1946.80.
The previous day high was 1948.17 while the previous day low was 1919.91. The daily 38.2% Fib levels comes at 1937.37, expected to provide support. Similarly, the daily 61.8% fib level is at 1930.71, expected to provide support.
Gold price (XAU/USD) holds onto the bullish bias for the fourth consecutive day as it rises to the fresh high since April 2022 to near $1,950 during early Thursday. In doing so, the precious metal cheers the broad-based US Dollar weakness ahead of the first readings of the United States’ fourth quarter (Q4) Gross Domestic Product (GDP). It’s worth noting that the contrasting play between the hawkish concerns surrounding the European Central Bank (ECB) and the dovish bias over the US Federal Reserve (Fed) adds strength to the XAU/USD upside, via the softer USD.
US Dollar Index (DXY) remains on the back foot, bracing for the third weekly fall, as sellers attack the six-month low marked the last week around 101.30, close to 101.55 by the press time. Given the inverse relationship between the US Dollar and the Gold price, the yellow metal benefits from the lackluster USD.
It’s worth noting that hopes of a dovish Federal Open Market Committee (FOMC) grew stronger amid the Federal Reserve (Fed) policymakers’ two-week blackout and weigh on the US Dollar, which in turn propelled XAU/USD. The reason could be linked to the previously downbeat US data surrounding wages for December and activities for January. “Traders broadly expect the Fed to increase rates by 25 basis points (bps) next Wednesday, a step down from a 50 bps increase in December,” said Reuters.
Apart from the dovish Fed concerns, the hawkish comments from the European Central Bank (ECB), as well as the upbeat data from the bloc also weigh on the US Dollar and favor the Gold buyers. On Wednesday, Germany’s IFO Business Climate Index matched 90.2 forecasts for January versus 88.6 prior but the Current Assessment eased from 94.4 to 94.1, versus 95.0 expected. Further, the IFO Expectations for the said month also came in higher-than-consensus 85.0 while rising to 86.4, compared to 83.2 previous readings.
That said, ECB Governing Council member Gabriel Makhlouf became the last policymaker from the bloc’s central bank to fire the hawkish shot, suggesting a 50 bps rate hike, ahead of the one-week blackout pre-ECB. “We need to continue to increase rates at our meeting next week – by taking a similar step to our December decisions,” said ECB’s Makhlouf. Makhlouf further added that they need to increase rates again at the March meeting.
Although the US Dollar weakness propels the Gold price, the XAU/USD bear’s further dominance depends upon the first readings of the US fourth quarter (Q4) Gross Domestic Product (GDP), expected to print annualized growth of 2.6% versus 3.2% prior. Also important to watch will be the US Durable Goods Orders for December and the Q4 Personal Consumption Expenditure (PCE) data. Should the scheduled data print upbeat outcomes, the Gold traders may get a reason to pare the latest gains.
Also read: US Gross Domestic Product Preview: Three reasons to expect a US Dollar-boosting outcome
Gold price justifies the previous day’s upside break of a fortnight-old ascending resistance line to refresh the multiday high. Adding strength to the bullish bias could be the metal’s sustained trading beyond the 10-Day Moving Average (DMA), as well as the bullish signals from the Moving Average Convergence and Divergence (MACD) indicator.
It should be noted, however, that the overbought conditions of the Relative Strength Index (RSI) line, placed at 14, appears to challenge the XAU/USD bulls. On the same line could be a convergence of the March 2022 peak and an upward-sloping trend line from December 13, 2022, close to $1,967.
In a case where the Gold buyers cross the $1,967 hurdle, a run-up toward April 2022 high near $1,999 can’t be ruled out.
Alternatively, the immediate resistance-turned-support line, close to $1,943, restricts the nearby downside of the Gold price ahead of the 10-DMA level of $1,927.
Following that, the $1,900 round figure will precede the previous weekly low near $1,896 to act as the last defense of the XAU/USD buyers.
Overall, Gold remains bullish but the upside room appears limited.
Trend: Limited upside expected
Technical Levels: Supports and Resistances
XAUUSD currently trading at 1948.36 at the time of writing. Pair opened at 1946.73 and is trading with a change of 0.08% % .
| Overview | Overview.1 | |
|---|---|---|
| 0 | Today last price | 1948.36 |
| 1 | Today Daily Change | 1.63 |
| 2 | Today Daily Change % | 0.08% |
| 3 | Today daily open | 1946.73 |
The pair remains strongly bullish on the daily timeframe. It trades above its 20 SMA @ 1885.23, 50 SMA 1822.32, 100 SMA @ 1750.98 and 200 SMA @ 1775.61.
| Trends | Trends.1 | |
|---|---|---|
| 0 | Daily SMA20 | 1885.23 |
| 1 | Daily SMA50 | 1822.32 |
| 2 | Daily SMA100 | 1750.98 |
| 3 | Daily SMA200 | 1775.61 |
The previous day high was 1948.17 while the previous day low was 1919.91. The daily 38.2% Fib levels comes at 1937.37, expected to provide support. Similarly, the daily 61.8% fib level is at 1930.71, expected to provide support.
Note the levels of interest below:
- Pivot support is noted at 1928.37, 1910.01, 1900.11
- Pivot resistance is noted at 1956.63, 1966.53, 1984.89
| Levels | Levels.1 |
|---|---|
| Previous Daily High | 1948.17 |
| Previous Daily Low | 1919.91 |
| Previous Weekly High | 1937.57 |
| Previous Weekly Low | 1896.63 |
| Previous Monthly High | 1833.38 |
| Previous Monthly Low | 1765.89 |
| Daily Fibonacci 38.2% | 1937.37 |
| Daily Fibonacci 61.8% | 1930.71 |
| Daily Pivot Point S1 | 1928.37 |
| Daily Pivot Point S2 | 1910.01 |
| Daily Pivot Point S3 | 1900.11 |
| Daily Pivot Point R1 | 1956.63 |
| Daily Pivot Point R2 | 1966.53 |
| Daily Pivot Point R3 | 1984.89 |
[/s2If]
Join Our Telegram Group
")


