The index rebounds after dropping to multi-month lows at 101.50. (Pivot Orderbook analysis)
…
This is a premium post.
[s2If !current_user_can(access_s2member_level4)]Please register for PREMIUM VERSION HERE to read full post below containing analysis. In case of any error or you think you are not able to read the full post below, please email us at support#nehcap.com [lwa][/s2If] [s2If current_user_can(access_s2member_level4)]
- The index rebounds after dropping to multi-month lows at 101.50.
- The dollar’s negative outlook remains unchanged below 106.50.
The pair currently trades last at 101.82.
The previous day high was 102.12 while the previous day low was 101.57. The daily 38.2% Fib levels comes at 101.78, expected to provide support. Similarly, the daily 61.8% fib level is at 101.91, expected to provide resistance.
DXY manages to regain some composure and bounces off earlier 8-month lows in the mid-101.00s on Thursday.
Despite the rebound, the index remains well under pressure and a sustainable breach of the 101.50 level should accelerate losses to, initially, the May 2022 low around 101.30 (May 30) prior to the psychological 100.00 yardstick.
On the upside, the so far weekly high at 102.89 (January 18) is expected to offer minor resistance.
In the meantime, while below the 200-day SMA at 106.47, the index is expected to risk extra losses.
Technical Levels: Supports and Resistances
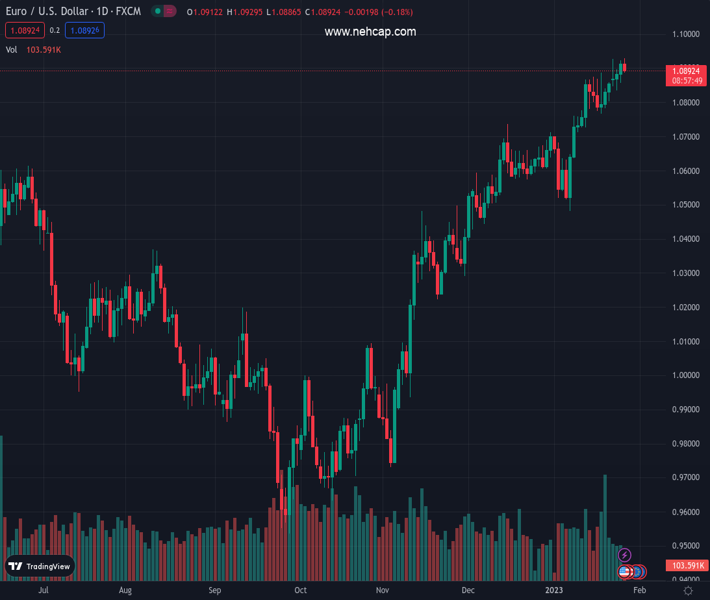
EURUSD currently trading at 101.82 at the time of writing. Pair opened at 101.64 and is trading with a change of 0.18 % .
| Overview | Overview.1 | |
|---|---|---|
| 0 | Today last price | 101.82 |
| 1 | Today Daily Change | 37.00 |
| 2 | Today Daily Change % | 0.18 |
| 3 | Today daily open | 101.64 |
The pair remains strongly bearish on the daily time frame. It trades below the 20 SMA @ 103.01, 50 SMA 104.17, 100 SMA @ 107.26 and 200 SMA @ 106.76.
| Trends | Trends.1 | |
|---|---|---|
| 0 | Daily SMA20 | 103.01 |
| 1 | Daily SMA50 | 104.17 |
| 2 | Daily SMA100 | 107.26 |
| 3 | Daily SMA200 | 106.76 |
The previous day high was 102.12 while the previous day low was 101.57. The daily 38.2% Fib levels comes at 101.78, expected to provide support. Similarly, the daily 61.8% fib level is at 101.91, expected to provide resistance.
Note the levels of interest below:
- Pivot support is noted at 101.43, 101.22, 100.87
- Pivot resistance is noted at 101.98, 102.33, 102.54
| Levels | Levels.1 |
|---|---|
| Previous Daily High | 102.12 |
| Previous Daily Low | 101.57 |
| Previous Weekly High | 102.90 |
| Previous Weekly Low | 101.51 |
| Previous Monthly High | 106.02 |
| Previous Monthly Low | 103.39 |
| Daily Fibonacci 38.2% | 101.78 |
| Daily Fibonacci 61.8% | 101.91 |
| Daily Pivot Point S1 | 101.43 |
| Daily Pivot Point S2 | 101.22 |
| Daily Pivot Point S3 | 100.87 |
| Daily Pivot Point R1 | 101.98 |
| Daily Pivot Point R2 | 102.33 |
| Daily Pivot Point R3 | 102.54 |
[/s2If]
Join Our Telegram Group
")


