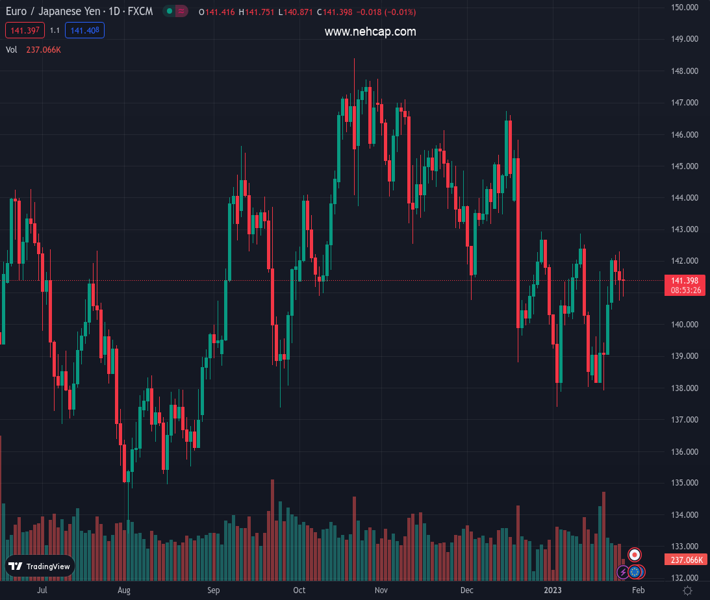
#EURJPY @ 141.394 regains the 141.00 barrier following a drop to 140.90/85. (Pivot Orderbook analysis)
…
This is a premium post.
[s2If !current_user_can(access_s2member_level4)]Please register for PREMIUM VERSION HERE to read full post below containing analysis. In case of any error or you think you are not able to read the full post below, please email us at support#nehcap.com [lwa][/s2If] [s2If current_user_can(access_s2member_level4)]
- EUR/JPY regains the 141.00 barrier following a drop to 140.90/85.
- The loss of the key 200-day SMA should expose extra losses.
The pair currently trades last at 141.394.
The previous day high was 142.3 while the previous day low was 140.76. The daily 38.2% Fib levels comes at 141.35, expected to provide support. Similarly, the daily 61.8% fib level is at 141.71, expected to provide resistance.
EUR/JPY now treads water in the 141.40 region after bottoming out in weekly lows near 140.80 earlier in the session on Thursday.
In case the downside accelerates, the next support of note emerges at the 200-day SMA, today at 140.80. A sustainable drop below the latter exposes extra weakness to, initially, the 138.00 neighbourhood.
The constructive outlook for EUR/JPY is seen unchanged above the 200-day SMA for the time being.
Technical Levels: Supports and Resistances
EURJPY currently trading at 141.41 at the time of writing. Pair opened at 141.45 and is trading with a change of -0.03 % .
| Overview | Overview.1 | |
|---|---|---|
| 0 | Today last price | 141.41 |
| 1 | Today Daily Change | 88.00 |
| 2 | Today Daily Change % | -0.03 |
| 3 | Today daily open | 141.45 |
The pair is trading above its 20 Daily moving average @ 140.39, below its 50 Daily moving average @ 142.27 , below its 100 Daily moving average @ 143.14 and above its 200 Daily moving average @ 140.83
| Trends | Trends.1 | |
|---|---|---|
| 0 | Daily SMA20 | 140.39 |
| 1 | Daily SMA50 | 142.27 |
| 2 | Daily SMA100 | 143.14 |
| 3 | Daily SMA200 | 140.83 |
The previous day high was 142.3 while the previous day low was 140.76. The daily 38.2% Fib levels comes at 141.35, expected to provide support. Similarly, the daily 61.8% fib level is at 141.71, expected to provide resistance.
Note the levels of interest below:
- Pivot support is noted at 140.71, 139.96, 139.16
- Pivot resistance is noted at 142.25, 143.05, 143.79
| Levels | Levels.1 |
|---|---|
| Previous Daily High | 142.30 |
| Previous Daily Low | 140.76 |
| Previous Weekly High | 141.69 |
| Previous Weekly Low | 137.92 |
| Previous Monthly High | 146.73 |
| Previous Monthly Low | 138.80 |
| Daily Fibonacci 38.2% | 141.35 |
| Daily Fibonacci 61.8% | 141.71 |
| Daily Pivot Point S1 | 140.71 |
| Daily Pivot Point S2 | 139.96 |
| Daily Pivot Point S3 | 139.16 |
| Daily Pivot Point R1 | 142.25 |
| Daily Pivot Point R2 | 143.05 |
| Daily Pivot Point R3 | 143.79 |
[/s2If]
Join Our Telegram Group
")


